See what happens when speculative fever cools down
The market itself provides its own clues about its future price action. One such clue is found in higher-beta small cap stocks vs. lower-beta blue chips. Get our take.
Every bull and bear market has a beginning and an end.
That would seem to be an obvious statement, but during an extended financial trend, a “no end in sight” sentiment usually develops. Many market observers perceive the protracted trend as the norm.
A perfect example is the current uptrend in the stock market: It started in March 2009 and is still going strong, with the Dow Industrials posting a string of record highs.
This Aug. 4 CNBC headline conveys the optimistic extreme:
‘The bull market could continue forever’ — strategist outlines conditions
But, we’ll stick with the idea that every financial trend has a sunrise and a sunset, including this one.
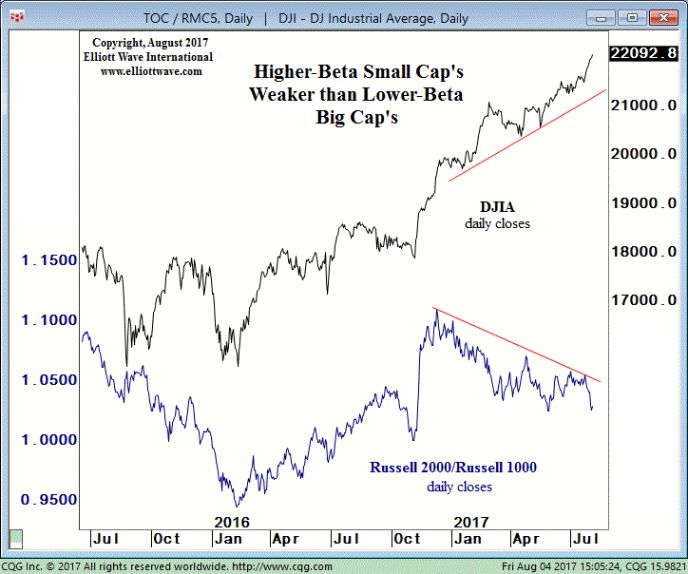
Review this chart and commentary from our Aug. 4 Short Term Update:

When speculation fades as investors narrow their focus into big-cap stocks to the detriment of small-cap stocks, it provides the early-warning basis to watch the stock market’s big-cap indexes closely, because the rising trend has entered its sunset phase. The chart shows just how dramatic the divergence has become. The Russell 2000/Russell 1000 stock ratio made a countertrend rally high on December 8, 2016 and has trended lower, as the DJIA has trended higher. On Aug. 3, the ratio essentially matched its low of the year, with the DJIA pushing to another new high today.
With what has just been discussed in mind, you might be wondering how other bull markets have ended.
Our August Elliott Wave Financial Forecast provides perspective on the two most recent ones:
Many major stock market peaks are battles of attrition … . In 2007, for example, the Small-Cap indexes, Mid-Cap indexes, the Dow Jones Composite Index and the Value Line Indexes all made highs in June-July 2007 and failed to join the Dow Jones Industrial Average, S&P 500 and NASDAQ at new highs in October 2007. In the wake of that non-confirmation, all stock indexes declined in a major bear market … . On rare occasions, a big bull market will end in conjunction with peak optimism. The NASDAQ’s top in 2000 ended after it closed higher 19 out of 21 weeks during its final push to the March 2000 peak.
At this juncture, we don’t know if the end of the current bull market will more closely resemble that of 2007 or 2000.
But, we do have reason to suspect that 2017 will turn out to be a pivotal year.
|
3 Videos + 8 Charts = Opportunities You Need to See.
Join this free event hosted by Elliott Wave International and you’ll get a clear picture of what’s next in a variety of U.S. markets. After seeing these videos and charts you will be ready to jump on opportunities and sidestep risks in some major markets. This free report (normally a $29 value) will present a unique outlook and give you a new perspective on the markets you won’t get anywhere else. |
This article was syndicated by Elliott Wave International and was originally published under the headline Stock Market: Sunrise and Sunset. EWI is the world’s largest market forecasting firm. Its staff of full-time analysts led by Robert Prechter provides 24-hour-a-day market analysis to institutional and private investors around the world.