Why U.S. Corporate Bankruptcies Could Skyrocket
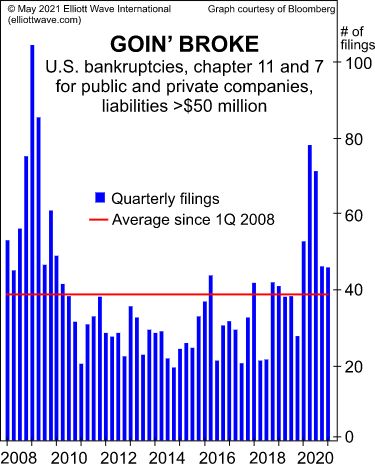
“U.S. bankruptcies in the first quarter of 2021 and all of 2020 were above the 13-year average”
An April 17 article headline on the website of National Public Radio says:
U.S Economy Looking Good As Spending Jumps In March
And, on April 29, The New York Times said:
Americans’ spending on durable goods — cars and furniture and other goods meant to last a long time — rose at a stunning 41.4 percent annual rate in the first three months of the year.
Considering that the economy is “looking good,” economic observers might conclude that a wave of corporate bankruptcies is of little concern.
However, that conclusion would be off the mark.
The June Global Market Perspective, a monthly Elliott Wave International publication which offers coverage of 50+ worldwide financial markets, provides insight with this chart and commentary:

U.S. bankruptcies in the first quarter of 2021 and all of 2020 were above the 13-year average. In March, there were 61 announced corporate bankruptcies, the highest total since July 2020. If companies are defaulting in record numbers in China and at above average levels in the U.S. with interest rates at historic low levels, what will happen when rates rise appreciably?
That’s right, defaults would zoom higher.
Understand that in the U.S., “the level of outstanding corporate bonds is the highest in history at approximately $10.6 trillion.” This represents almost half of annual U.S. GDP.
A positive social mood has led executives at many U.S. firms to believe that they can issue and service ever-increasing levels of debt.
But interest rates may rise a lot higher than many businesspeople expect. Hence, many corporate bonds would lose value.
Indeed, the June Global Market Perspective provides Elliott wave analysis of the iShares Core U.S. Aggregate Bond ETF, the largest exchange-traded bond fund in terms of assets.
If you’d like to learn about Elliott wave analysis, you can do so by reading the online version of Frost & Prechter’s Elliott Wave Principle: Key to Market Behavior for free. Here’s a quote from the book:
In the 1930s, Ralph Nelson Elliott discovered that stock market prices trend and reverse in recognizable patterns. The patterns he discerned are repetitive in form but not necessarily in time or amplitude. Elliott isolated five such patterns, or “waves,” that recur in market price data. He named, defined and illustrated these patterns and their variations. He then described how they link together to form larger versions of themselves, how they in turn link to form the same patterns of the next larger size, and so on, producing a structured progression. He called this phenomenon The Wave Principle.
This Wall Street classic can be on your computer screen in mere moments after you join Club EWI — the world’s largest Elliott wave educational community (about 350,000 members and growing rapidly.)
Joining Club EWI is 100% free and you are under no obligation as a member.
Here’s the link to follow: Elliott Wave Principle: Key to Market Behavior — free and unlimited access.