Will These 2 Sectors Lead the Stock Market Lower?
This key sector continues to be “fragile”
Although it doesn’t feel like it sometimes, the U.S. stock market has been in a downtrend since January 2022.
The reason it doesn’t feel like it is because the S&P 500 has been in a narrow trading range between about 3700 and 4300 for more than six months — going back to at least November.
Some observers believe a narrow trading range will persist (Reuters, May 24):
Stocks set for range trading as central banks near end game: Reuters poll
Unsurprisingly, some believe that if stocks break out of this trading range, it will be to the upside.
The strong rally on June 2 — when the Dow Industrials surged more than 700 points — certainly lends credence to that bullish opinion.
Of course, there’s the possibility that more upside is ahead.
However, in addition to using Elliott wave analysis, Elliott Wave International regularly reviews dozens of market indicators and we see a lot of red flags for the market.
If, indeed, the bear market is not over, which sectors will lead the way lower?
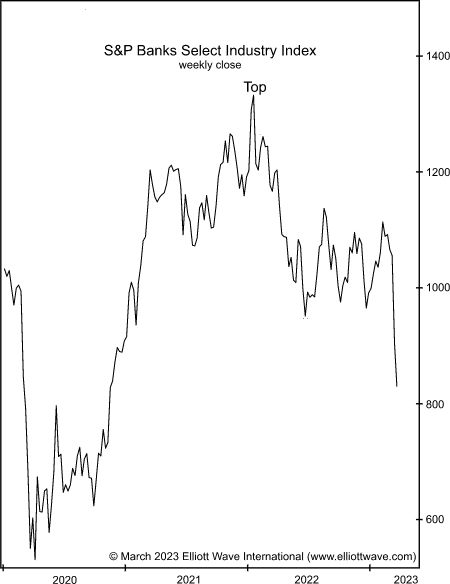
Well, one of the prime candidates is the banking sector.
Back on March 17, the Elliott Wave Theorist, a monthly publication which covers major financial and cultural trends, showed this chart (wave labels included for subscribers) and said:

It is well to keep in mind how fragile the banking system is. … [The chart] shows that the banking sector is emerging as a downside leader.
As I write on June 5, there’s nothing about the index’s price action which would alter our March analysis.
Another sector to keep in mind is technology.
As the June Elliott Wave Financial Forecast, a publication which covers major U.S. financial markets, noted:
The NASDAQ’s recent outperformance is dramatic relative to the market’s most senior stock index, the Dow Jones Industrial Average.
Of course, the NASDAQ is dominated by big tech names. If they finally reverse, keep in mind that sectors which lead on the upside often turn around and lead on the downside.
A key way to keep on top of the NASDAQ (as well as other stock indexes) is to employ the Elliott wave model.
If you’re unfamiliar with Elliott wave analysis, read Frost & Prechter’s Elliott Wave Principle: Key to Market Behavior. Here’s a quote from the book:
All waves may be categorized by relative size, or degree. The degree of a wave is determined by its size and position relative to component, adjacent and encompassing waves. [R.N.] Elliott named nine degrees of waves, from the smallest discernible on an hourly chart to the largest wave he could assume existed from the data then available. He chose the following terms for these degrees, from largest to smallest: Grand Supercycle, Supercycle, Cycle, Primary, Intermediate, Minor, Minute, Minuette, Subminuette. Cycle waves subdivide into Primary waves that subdivide into Intermediate waves that in turn subdivide into Minor waves, and so on. The specific terminology is not critical to the identification of degrees, although out of habit, today’s practitioners have become comfortable with Elliott’s nomenclature.
Get free access to the entire online version of this Wall Street classic by signing up for a free Club EWI membership.
In case you don’t know, Club EWI is the world’s largest Elliott wave educational community and members enjoy complimentary access to a wealth of Elliott wave resources on investing and trading.
Get started by following this link: Elliott Wave Principle: Key to Market Behavior — get free access.