Stocks and Junk Bonds: “This Divergence Appears Meaningful”
“Everything was aligned until February 2”
The trends of the junk bond and stock markets tend to be correlated.
The reason why is that junk bonds and stocks are closely affiliated in the pecking order of creditors in case of default. The rank of junk bonds is only slightly higher than equities because debt involves a contract.
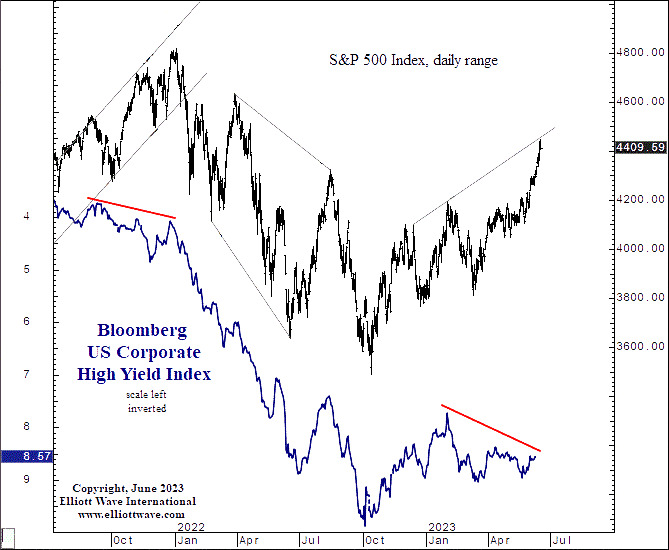
Given these two markets are usually correlated, it’s worth paying attention when a divergence takes place. Indeed, a divergence is in the works now. In other words, while stocks have been holding up, the price of junk bonds have been trending lower for much of the year.
Here’s a headline from a few months ago (Reuters, March 16):
Investors shun high-yield bonds on recession, banking risks
At the same time, as mentioned, the S&P 500 and especially the NASDAQ has remained elevated.
The June 16 U.S. Short Term Update, which is a thrice weekly Elliott Wave International publication, discussed this divergence via this chart and commentary:

The graph shows that junk bonds diverged relative to stocks at the January 2022 peak, when stocks started their bear market. Both trends then came into alignment during the decline as well as the countertrend rallies that were interspersed in the selloff. Everything was aligned until February 2, which is when the yield on junk bonds made a low (shown as a high on the inverted chart). Yields then started to rise but instead of stocks declining, which would keep both trends side by side, equities continued to rally. This divergence appears meaningful.
The U.S. Short Term Update goes on to say that this divergence is not meant to be used for near-term market timing. But it is an indicator to keep in mind along with other indicators as well as the Elliott wave model.
If you’re unfamiliar with Elliott wave analysis or need to re-acquaint yourself, you are encouraged to delve into the definitive text on the subject, Elliott Wave Principle: Key to Market Behavior, by Frost & Prechter.
Here’s a quote from the book:
After you have acquired an Elliott “touch,” it will be forever with you, just as a child who learns to ride a bicycle never forgets. Thereafter, catching a turn becomes a fairly common experience and not really too difficult. Furthermore, by giving you a feeling of confidence as to where you are in the progress of the market, a knowledge of Elliott can prepare you psychologically for the fluctuating nature of price movement and free you from sharing the widely practiced analytical error of forever projecting today’s trends linearly into the future. Most important, the Wave Principle often indicates in advance the relative magnitude of the next period of market progress or regress. Living in harmony with those trends can make the difference between success and failure in financial affairs.
Here’s the good news: You can read the entire online version of the book for free once you become a Club EWI member.
Club EWI is the world’s largest Elliott wave educational community and is free to join. Moreover, members enjoy free access to a wealth of Elliott wave resources on investing and trading.
Get started by following this link: Elliott Wave Principle: Key to Market Behavior — get free and unlimited access now.