Is Outsized Stock Returns the Norm?
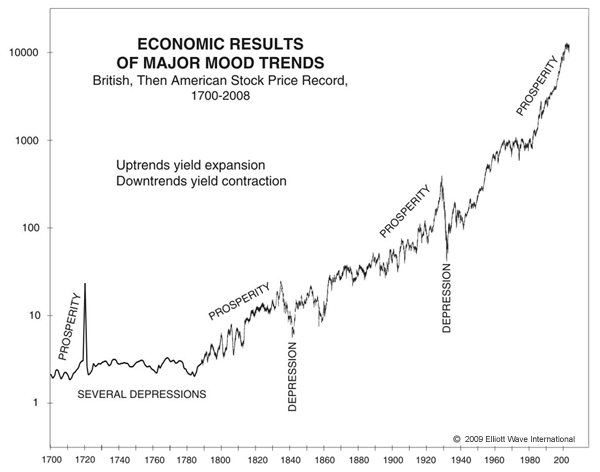
Below is a chart that shows the historic returns, adjusted for inflation, for the UK market for the last 200 years. It speaks for itself. It looks like a bell curve which shows the highest probable return for the stock market is -2% to +4%. If your 401k is long heavily in stocks based on common wisdom of this age, you may be betting that the 1 in 15 chance on the very right edge of the graph will happen again.

Prechter’s book Conquer the Crash explains the normal valuations that typically appear at major market bottoms. It also explains what a market top looks like. It is a must read to understand how bubbles form and how they burst. To understand the big picture, please read below his insightful explanation about how big the stock bubble is.
In today’s investment culture, average Joe, an individual of middle class is an investor. He takes a large portion of his money and typically puts in stocks and bonds in his 401K. This tendency has started in 1980s and continued at increasing speed to this date. The last 20 years of 20th century witnessed a major bull market. Huge gains were made and the crowd took it granted. It became the norm. One would put his money in stocks and enjoy comfortable retirement. But is it really so? Can we make such assumptions about market returns without doing our homework? Financial markets always have and always will pose two basic questions that investors seek to answer:
- What’s the direction of the main trend?
- How far will it go?
Systematic approaches to these questions commonly belong to either fundamental or technical analysis. Let’s consider each one briefly.
Fundamental analysis studies how a market behaves in response to external influences such as earnings, sales, competitive outlook, economic outlook and the like.
Technical analysis studies a market’s internal behavior — mainly price, but also internal measures like volume.
Elliott wave analysis is a branch of technical analysis, specifically pattern recognition.
In the 1930s, Ralph Nelson Elliott discovered that stock market prices trend and reverse in recognizable patterns…Elliott isolated five such patterns, or “waves,” that recur in market price data.
Elliott Wave Principle: Key to Market Behavior (p. 19)
In a five-wave progression, the third wave is the most powerful.
Third waves unfold in bull and bear markets alike. Elliott Wave Principle (p. 80) describes a third wave in a bull market:
Third waves are wonders to behold. They are strong and broad, and the trend at this point is unmistakable…Third waves usually generate the greatest volume and price movement and are most often the extended wave in a series. It follows, of course, that the third wave of a third wave, and so on, will be the most volatile point of strength in any wave sequence.
Stock Markets Can Drop Like a Rock
Third waves can be more powerful during market declines because fear is a stronger emotion than greed.
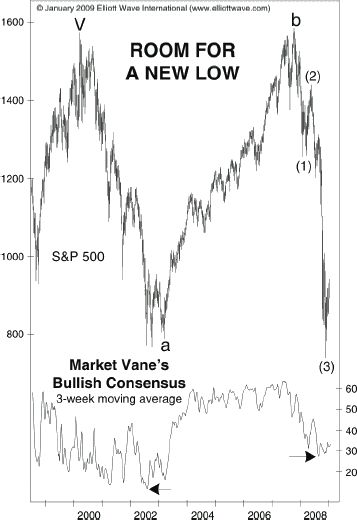
Look at the third wave on this S&P 500 chart which published in the January 2009 Elliott Wave Financial Forecast. Notice that prices dropped like a rock, plunging well over 600 points in less than a year. (The third wave starts where the chart shows (2) and ends at (3)):

You can see on the chart that the S&P 500 had rebounded after the third wave had bottomed. Even so, the chart’s title states that there was “Room for a New Low.” Indeed, after the rebound which was wave (4), wave (5) took prices to a March 6, 2009 intraday low of 666.79.
How about now?
That depends on who you ask.
Because Elliott analysts know that during a market downtrend, second waves can convince investors that the rally is a new bull market.
That can be a financially dangerous mind-set.
Optimism precedes third waves lower. Then, seemingly out of nowhere, a third wave can commence with unrelenting violence and speed.
In the chart above, you saw the optimism-driven rebound just before prices plunged.
Do not expect the financial media to provide you with advance warning of a third wave. The crowd is almost always on the wrong side of the market. Third waves arrive unannounced.
Long Term View of Stock Market

What is next?
 |
Read 8 FREE chapters of Conquer the Crash; You Can SURVIVE and PROSPER in a Deflationary DepressionThis free, 42-page report can help you prepare for your financial future. You’ll get valuable lessons on what to do with your pension plan, what to do if you run a business, how to handle calling in loans and paying off debt and so much more.Get Instant Access to Your FREE 8-Lesson “Conquer the Crash Collection” Here |