 |
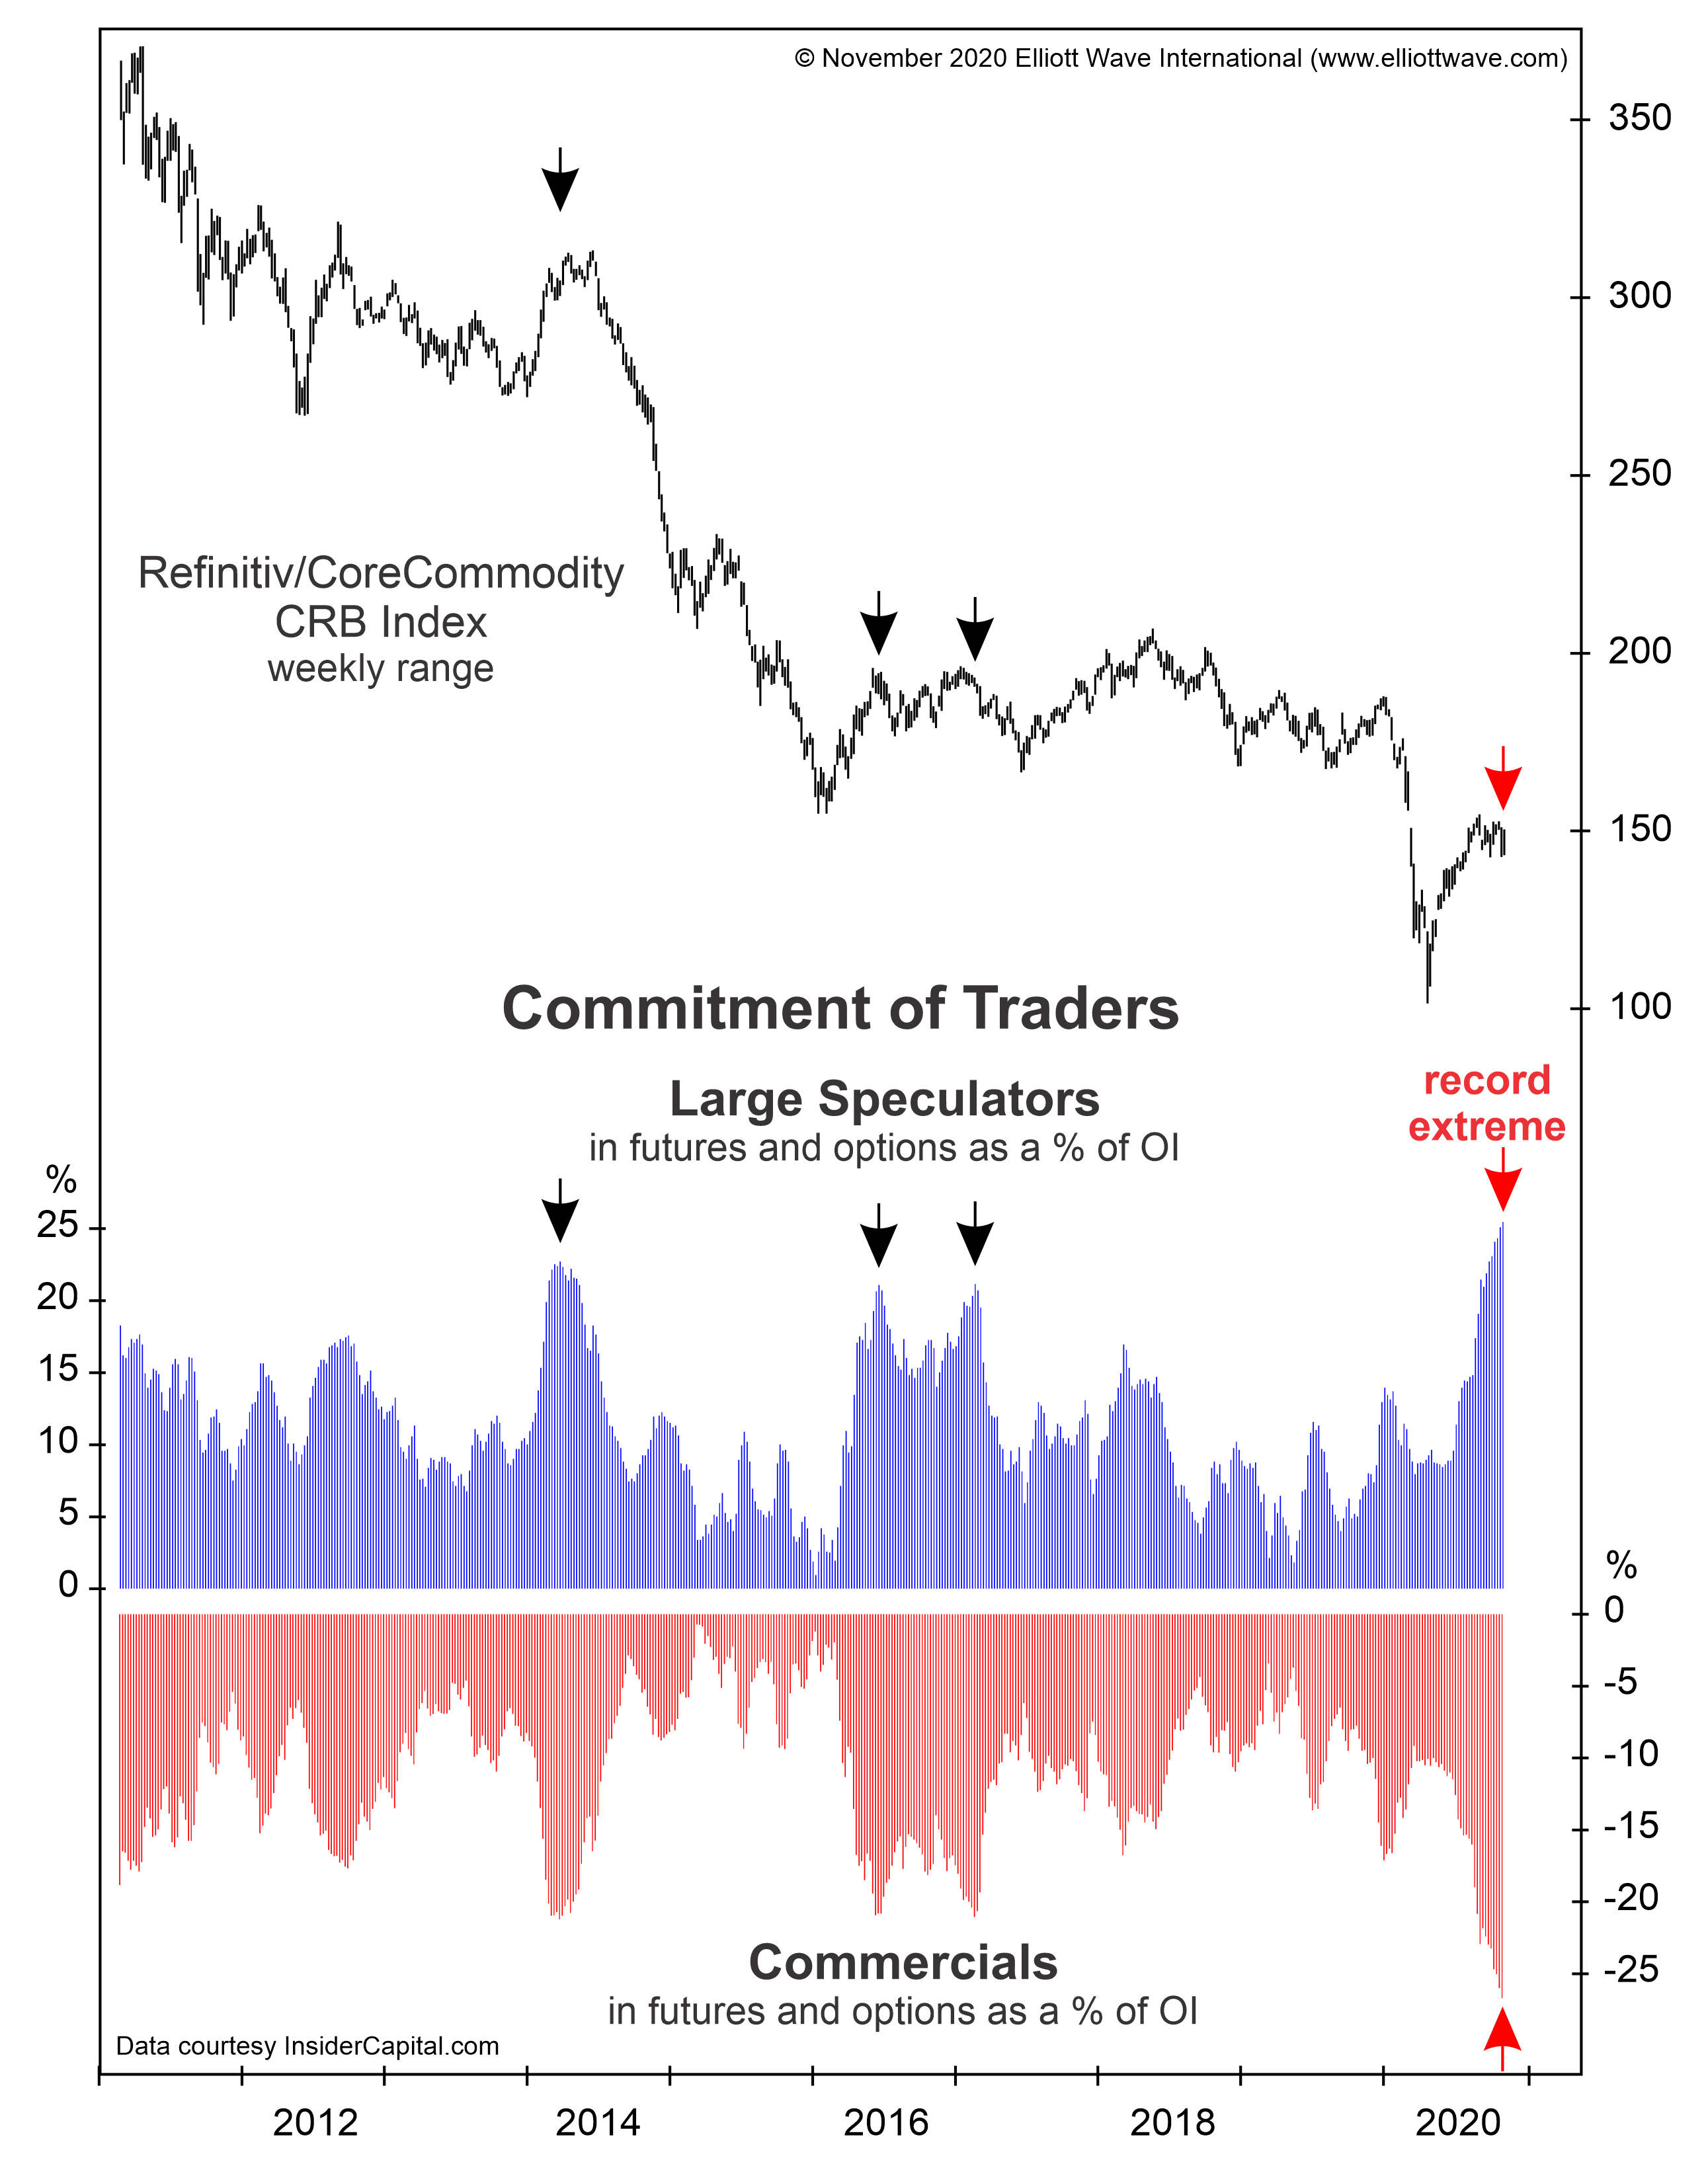
Small Traders vs. Large Traders vs. Commercials: Who Is Right Most Often? When one of these groups acts, “the odds become high for a change of trend” It’s useful to know who is doing what in particular financial markets. You’ll find out why as we proceed, however, let’s first start off with some basic background… Read more Smart Money vs Dumb Money |
Category: Stock Market
Articles about stock market, market timing, technical indicators, stock market trends, market top, market bottom.
Nobody is Selling Short – Is it a Top?
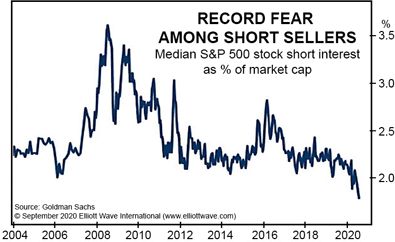 |
Fear Grips Stock Market Short-Sellers — What to Make of It “This is easily the lowest wager against rising S&P rises” in the history of the data As you may know, short-selling a stock means that a speculator is betting that the price will go down. This is a lot riskier than taking a “long”… Read more Nobody is Selling Short – Is it a Top? |
Gold Fibonacci Retracement
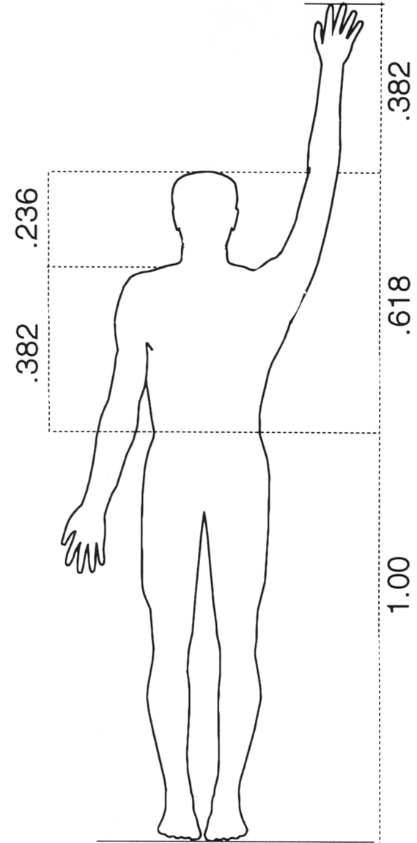 |
Gold: See What This Fibonacci Ratio Says About Trend A Fibonacci .618 retracement is a common reversal point in the markets Fibonacci numbers follow a sequence that begins with 0 and 1, and each subsequent number is the sum of the previous two (0, 1, 1, 2, 3, 5, 8, 13, 21, 34, and so… Read more Gold Fibonacci Retracement |
Put/Call Ratio at 20 Year Low
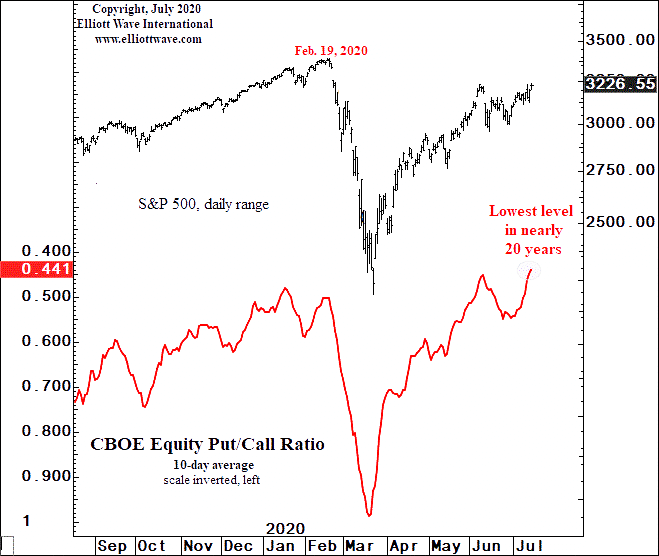 |
This Stock Market Indicator Reaches “Lowest Level in Nearly 20 Years” Here’s what happened “the last time the 10-day put/call ratio made a lower extreme” After a big trend reversal, it’s not unusual for the correction to retrace much of the initial sell-off or rally. Thus, many investors are fooled into believing that the old… Read more Put/Call Ratio at 20 Year Low |
Why Non-Confirmations Matter
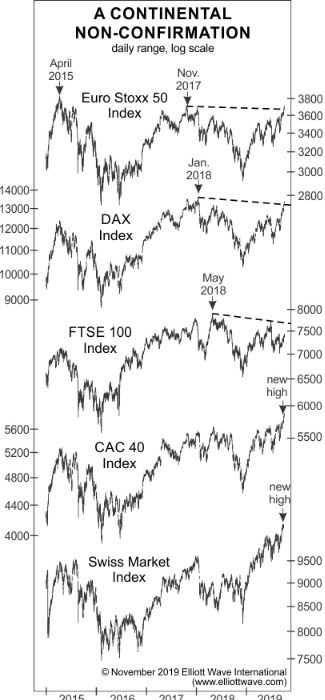 |
When a trend is strong, related markets tend to move in unison. However, when a trend is near exhaustion — a bullish or bearish trend, “non-confirmations” often occur. A non-confirmation occurs when one market makes a new high (or low), but a related market does not. As cases in point, our November Global Market Perspective… Read more Why Non-Confirmations Matter |
Is Gold at a Top?
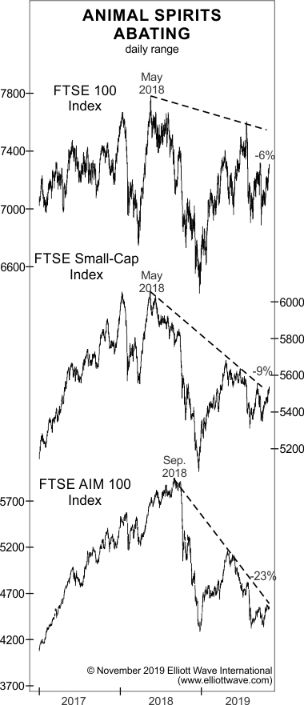 |
Gold and Silver: Pay Attention to This Noteworthy Record High Here’s what usually occurs in related financial markets when “big changes in social mood are afoot” Related financial markets tend to move together. For example, gold and silver. Or, consider stocks. When the Dow Industrials are up on a given trading day, the NASDAQ is… Read more Is Gold at a Top? |
Buying the dip?
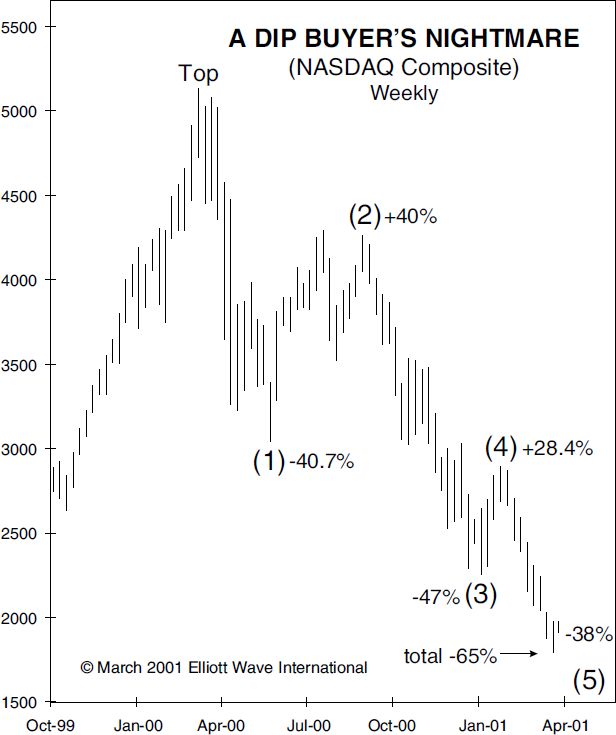 |
Stocks: Why “Buying the Dip” is Fraught with Danger Investors know that the main U.S. stock indexes have tumbled very quickly. On a historical basis, some may not realize just how quickly. A March 23 Marketwatch headline referred to a “mind-bending stat”: The S&P 500 has dropped 30% from peak to trough faster than any… Read more Buying the dip? |
Did the Oil Crash Wreck the Stock Market?
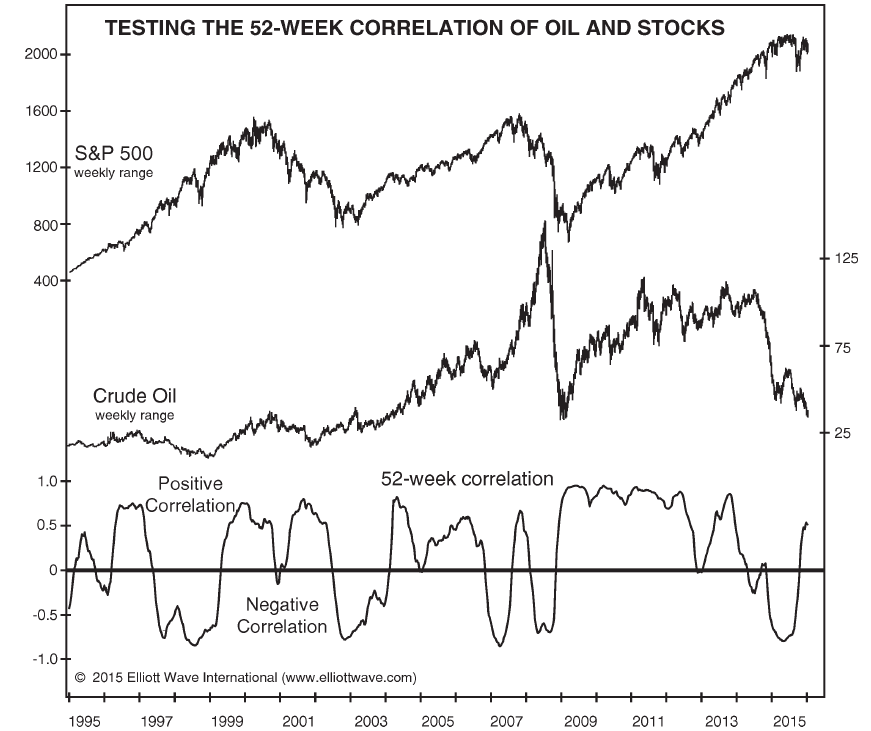 |
Crude oil took a 30% dive on Sunday, March 8. Yet what’s happened in oil this year is so much bigger than that headline-grabbing, one-day move. In January, oil was $64 a barrel. It hit $27.34 intraday on Monday, March 9, so the price of oil fell 57% in just two months. Talk about a… Read more Did the Oil Crash Wreck the Stock Market? |
A Long Term Look At the Stock Market
 |
Is Outsized Stock Returns the Norm? Below is a chart that shows the historic returns, adjusted for inflation, for the UK market for the last 200 years. It speaks for itself. It looks like a bell curve which shows the highest probable return for the stock market is -2% to +4%. If your 401k is… Read more A Long Term Look At the Stock Market |
How to Identify the Market Trend
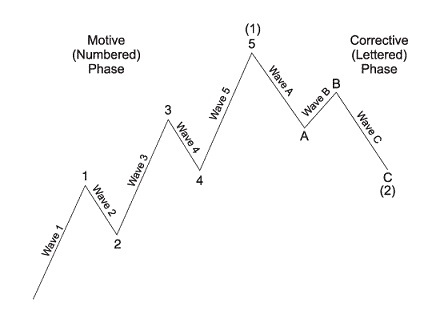 |
Fundamental analysis versus Elliott wave analysis: the winner for predicting the 9-year long commodity bear market is clear. 95% of traders fail. It’s a day-drinking, country-music kind of statistic. Think: “Friends in Sell-Low, Buy-High Places.” One article attempts to quantify the reasons, citing: “SCIENTIST DISCOVERED WHY MOST TRADERS LOSE MONEY — 24 SURPRISING STATISTICS.” See… Read more How to Identify the Market Trend |
Does Falling FED Rate Mean Higher Stock Prices?
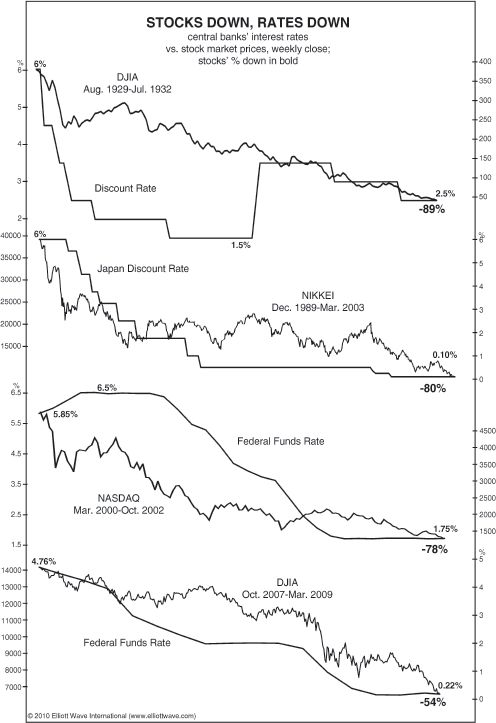 |
Achieving and maintaining success as a stock market investor is a tall order. You, like many others, probably watch financial TV networks, read analysis and talk to fellow investors, trying to understand what’s next for the stock market. One popular stock market “indicator” is interest rates. Mainstream analysts parse every word from the Fed, hoping… Read more Does Falling FED Rate Mean Higher Stock Prices? |
Why Oil Prices Fell
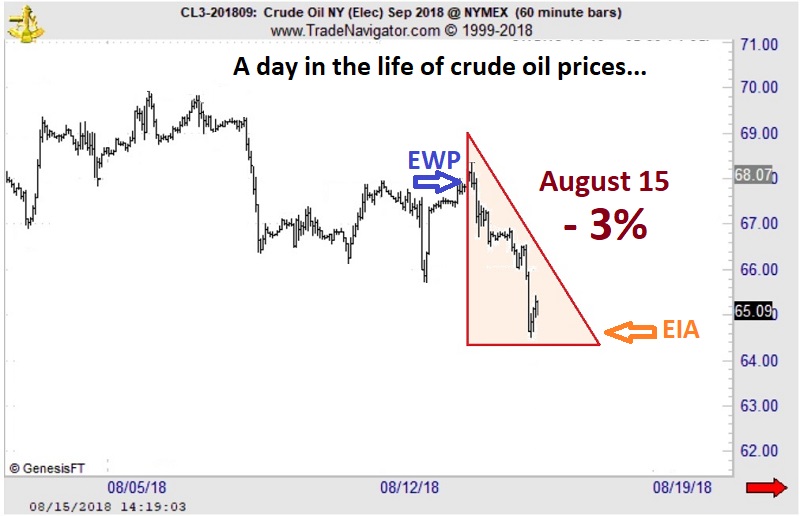 |
Why Oil Prices Fell — Stockpiles or Price Pattern? You be the judge… Let’s cut right to the chart below. The shaded triangle highlights the dramatic price action in crude oil prices on August 15, when crude plummeted 3% to its lowest level in over nine weeks. Now, according to the mainstream experts, the number… Read more Why Oil Prices Fell |
Is S&P 500 Over or Under Valued?
 |
3 Videos + 8 Charts = Opportunities You Need to See. Join this free event hosted by Elliott Wave International and you’ll get a clear picture of what’s next in a variety of U.S. markets. After seeing these videos and charts you will be ready to jump on opportunities and sidestep risks in some… Read more Is S&P 500 Over or Under Valued? |
Divergence Between Big Cap and Small Cap Stocks
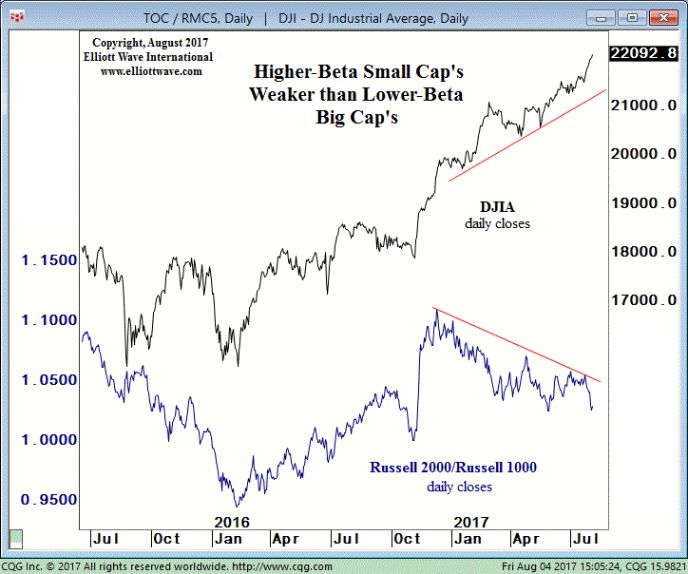 |
See what happens when speculative fever cools down The market itself provides its own clues about its future price action. One such clue is found in higher-beta small cap stocks vs. lower-beta blue chips. Get our take. Every bull and bear market has a beginning and an end. That would seem to be an… Read more Divergence Between Big Cap and Small Cap Stocks |
How To Beat Herding Impulse in the Financial Markets
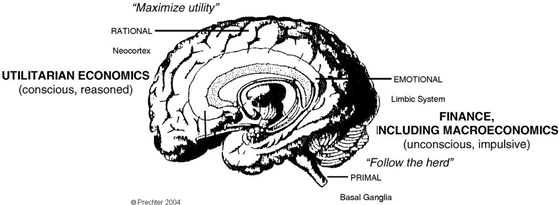 |
We all love a bargain… …Except when it comes to stocks. The reason boils down to uncertainty. We know what our fruits and vegetables should cost at the grocer’s — but we’re far less certain about how much to pay for a blue-chip stock or shares in an S&P 500 Index fund. So how does… Read more How To Beat Herding Impulse in the Financial Markets |
Bond Price Chart Completes Elliott Wave Pattern
 |
Recall This Bond Trader Chart? Here’s What Happened Our three recent Treasury Bond charts combine to show you trader sentiment, price action and important near-term turns and trends. Learn the Why, What and How of Elliott Wave AnalysisWatch the Elliott Wave Crash Course, FREE This three-video series demolishes the widely held notion that news… Read more Bond Price Chart Completes Elliott Wave Pattern |
Investors Should Expect the Unexpected
 |
Why Stock Market Investors Should Expect the Unexpected Read our forecast for a market rally in the wake of Brexit Investors who jump on “sure things” in the stock market usually lick their wounds with regret. The decision of British voters to leave the European Union appeared to represent low-hanging fruit to short sellers. After… Read more Investors Should Expect the Unexpected |
Is There a Tech Bubble?
 |
Silicon valley was not hit as hard during the financial crisis and the tech stocks have done well since. Nasdaq has reached all time high exceeding 2000 bubble levels, retreated a bit. Could we argue we are not at bubble levels yet? Was it business as usual for Facebook to pay 19 billion dollars for… Read more Is There a Tech Bubble? |
Bear Markets Move Fast!
 |
With today’s market action, I don’t have a lot of time, and I’m sure you don’t either, but I want to drop a quick note before things get too crazy this week. Here’s the deal: This morning, the Dow crashed 1,000 at the open and has since rebounded. China declined 8.5%. Europe and the S&P… Read more Bear Markets Move Fast! |
Stocks Slide Globally
 |
Is this the start of a global financial crash? “When the alarm goes off and the dreamers awake, it will be pandemonium in the stock market.” — Bob Prechter, from the just-released Elliott Wave Theorist. You would agree that markets around the world have served investors a lot of surprises lately: Crude oil just fell… Read more Stocks Slide Globally |