 |
Is Outsized Stock Returns the Norm? Below is a chart that shows the historic returns, adjusted for inflation, for the UK market for the last 200 years. It speaks for itself. It looks like a bell curve which shows the highest probable return for the stock market is -2% to +4%. If your 401k is… Read more A Long Term Look At the Stock Market |
How to Identify the Market Trend
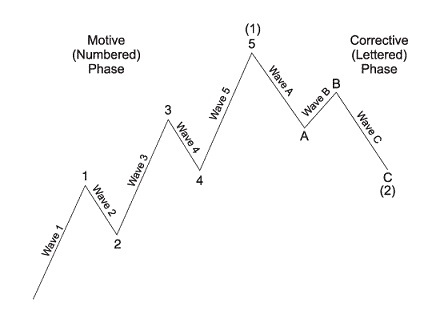 |
Fundamental analysis versus Elliott wave analysis: the winner for predicting the 9-year long commodity bear market is clear. 95% of traders fail. It’s a day-drinking, country-music kind of statistic. Think: “Friends in Sell-Low, Buy-High Places.” One article attempts to quantify the reasons, citing: “SCIENTIST DISCOVERED WHY MOST TRADERS LOSE MONEY — 24 SURPRISING STATISTICS.” See… Read more How to Identify the Market Trend |
Does Falling FED Rate Mean Higher Stock Prices?
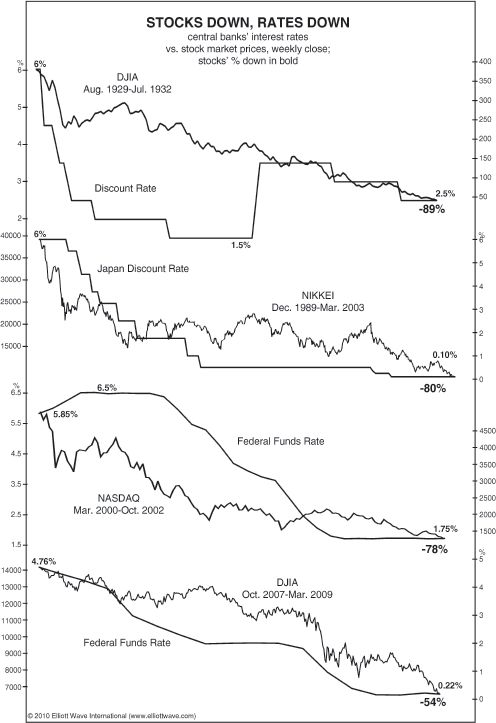 |
Achieving and maintaining success as a stock market investor is a tall order. You, like many others, probably watch financial TV networks, read analysis and talk to fellow investors, trying to understand what’s next for the stock market. One popular stock market “indicator” is interest rates. Mainstream analysts parse every word from the Fed, hoping… Read more Does Falling FED Rate Mean Higher Stock Prices? |
FED is Going To Cut the Rates Soon
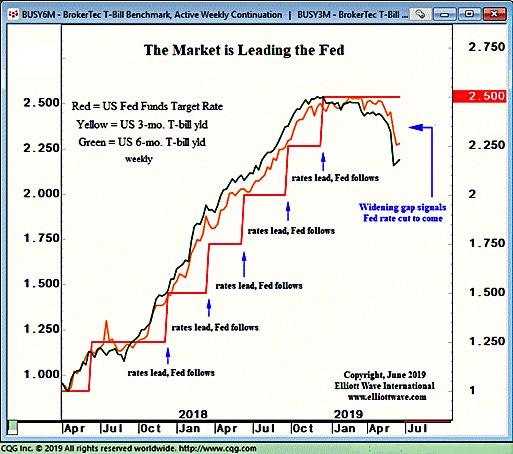 |
Elliott Wave: Market Signaling Fed to Cut Rates Soon We have tracked the U.S. Federal Reserve’s interest rates decisions for years. Back in March 24th, we said FED follows the market lead. This week, the Fed once again decided to keep the funds rate unchanged. We expect the Fed to change course soon. We have… Read more FED is Going To Cut the Rates Soon |
FED follows the market lead
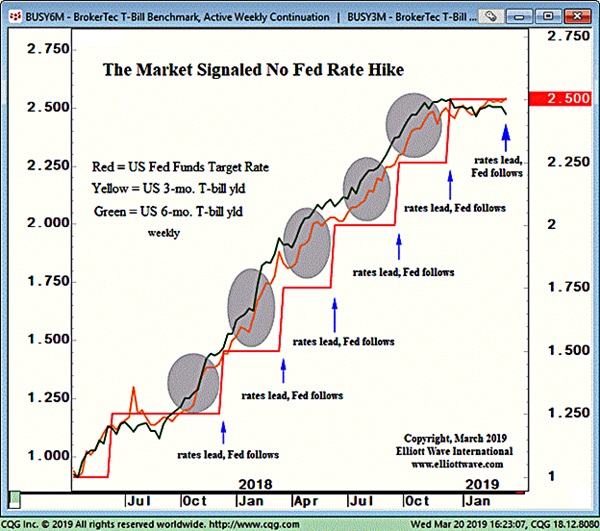 |
Back in December, Elliot Wave International wrote an article titled “Interest Rates Win Again as Fed Follows Market.” In the piece, it was noted that while most experts believe that central banks set interest rates, it’s actually the other way around—the market leads, and the Fed follows. They pointed out that the December rate hike… Read more FED follows the market lead |
The Economist – The World in 2019
 |
The Economist magazine, propaganda tool of the Globalist elite has a dark prediction for 2019. The cover is full black. There are speculations about what it really means. Is it the coming world war? Is it a financial crash? If yes, it is probably not a recession, but a depression that rivals Great Depression if… Read more The Economist – The World in 2019 |
Why Oil Prices Fell
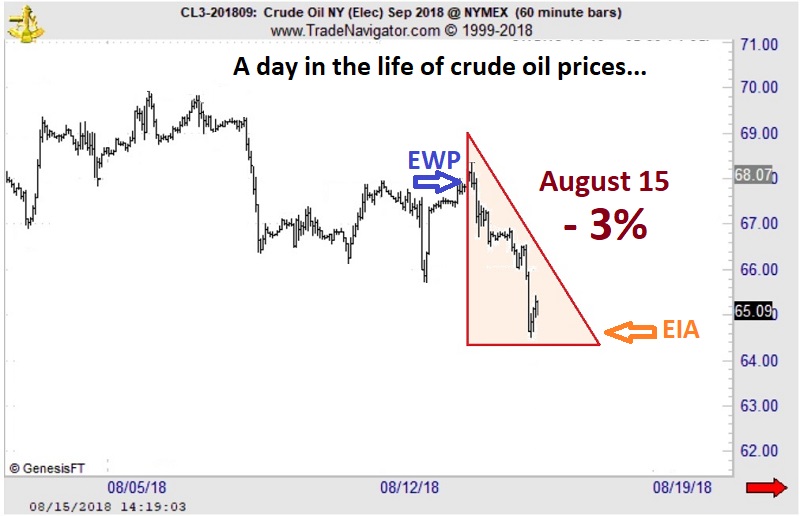 |
Why Oil Prices Fell — Stockpiles or Price Pattern? You be the judge… Let’s cut right to the chart below. The shaded triangle highlights the dramatic price action in crude oil prices on August 15, when crude plummeted 3% to its lowest level in over nine weeks. Now, according to the mainstream experts, the number… Read more Why Oil Prices Fell |
US dollar Elliott waves
 |
See the signs that could’ve helped you nail two junctures in the greenback’s trend The legendary football coach Vince Lombardi believed that a winning team is built on mastering the game’s basics — so much so that at the start of the season he would “remind” veteran players, “Gentlemen, this is a football.” Lombardi would… Read more US dollar Elliott waves |
Is The Bitcoin Bubble Popping?
 |
“I Wouldn’t Touch Bitcoin, Risk of Collapse Too Big” Bitcoin’s 50% crash was not entirely unexpected “Wild” doesn’t begin to describe Bitcoin’s price action. This spring, it traded as low as $1200. Last week, BTC futures topped $20,000. Yesterday (December 21), in an article by newsmax.com, Elliott Prechter warned about Bitcoin’s future: Elliott Prechter: I… Read more Is The Bitcoin Bubble Popping? |
Is S&P 500 Over or Under Valued?
|
3 Videos + 8 Charts = Opportunities You Need to See. Join this free event hosted by Elliott Wave International and you’ll get a clear picture of what’s next in a variety of U.S. markets. After seeing these videos and charts you will be ready to jump on opportunities and sidestep risks in some… Read more Is S&P 500 Over or Under Valued? |
Divergence Between Big Cap and Small Cap Stocks
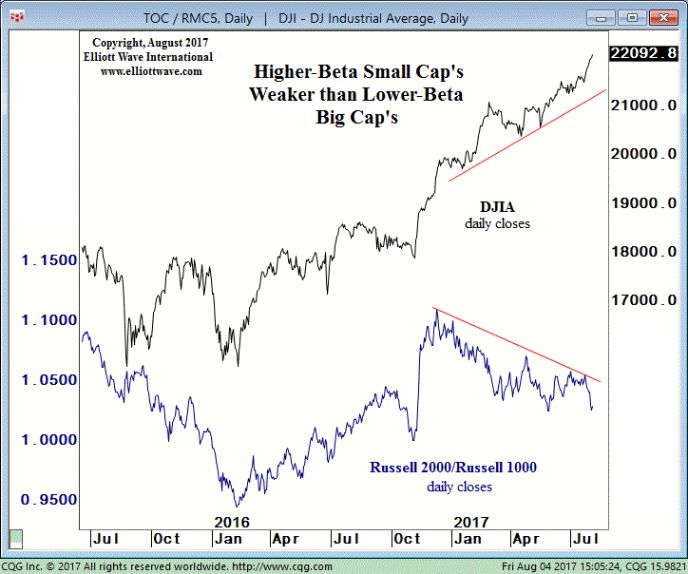 |
See what happens when speculative fever cools down The market itself provides its own clues about its future price action. One such clue is found in higher-beta small cap stocks vs. lower-beta blue chips. Get our take. Every bull and bear market has a beginning and an end. That would seem to be an… Read more Divergence Between Big Cap and Small Cap Stocks |
How To Beat Herding Impulse in the Financial Markets
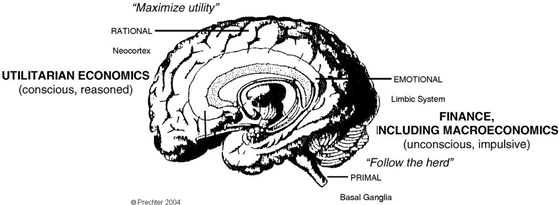 |
We all love a bargain… …Except when it comes to stocks. The reason boils down to uncertainty. We know what our fruits and vegetables should cost at the grocer’s — but we’re far less certain about how much to pay for a blue-chip stock or shares in an S&P 500 Index fund. So how does… Read more How To Beat Herding Impulse in the Financial Markets |
Socionomics and Elliott Waves
|
Robert Prechter Talks About Elliott Waves and Socionomics According to Socionomic theory, behavior of the aggregate population is patterned just like seasons, and that has far reaching ramifications, especially for financial markets. Let’s hear it from the father of the Socionomic theory, Robert Prechter. 1. How did you come across Elliott wave analysis? My dad… Read more Socionomics and Elliott Waves |
Financial Forecast 2017
|
Our friends at Elliott Wave International (EWI) regularly put out great free content on their site. If you’ve visited their site before, you may have seen “Chart of the Day,” a featured series of videos that take a quick, but close examination of a chart from one of EWI’s paid publications. Since Robert Folsom began… Read more Financial Forecast 2017 |
Crude Oil Sinks
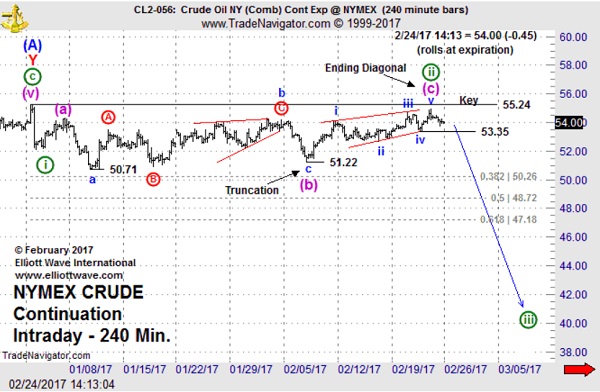 |
Crude Oil Sinks 20%: Why “Oversupply” Isn’t the Half of It Oil prices have defied bullish efforts to curb oversupply. Here’s our take on why. I have a friend… let’s call him Larry. Let’s just say, Larry is not a fan of taking risks. He likes his reflexes fast, his cars slow, and his financial… Read more Crude Oil Sinks |
Central Bank Balance Sheet Expansion Continues without INFLATION
|
See our global market charts that cover $18 TRILLION, inflation(?), and a truly bold forecast. What You Need to Know NOW About Protecting Yourself from Deflation Get this free, special report about the unexpected but imminent and grave risk to your portfolio. You’ll also get 29 specific forecasts for Stocks, Real Estate, Gold, New… Read more Central Bank Balance Sheet Expansion Continues without INFLATION |
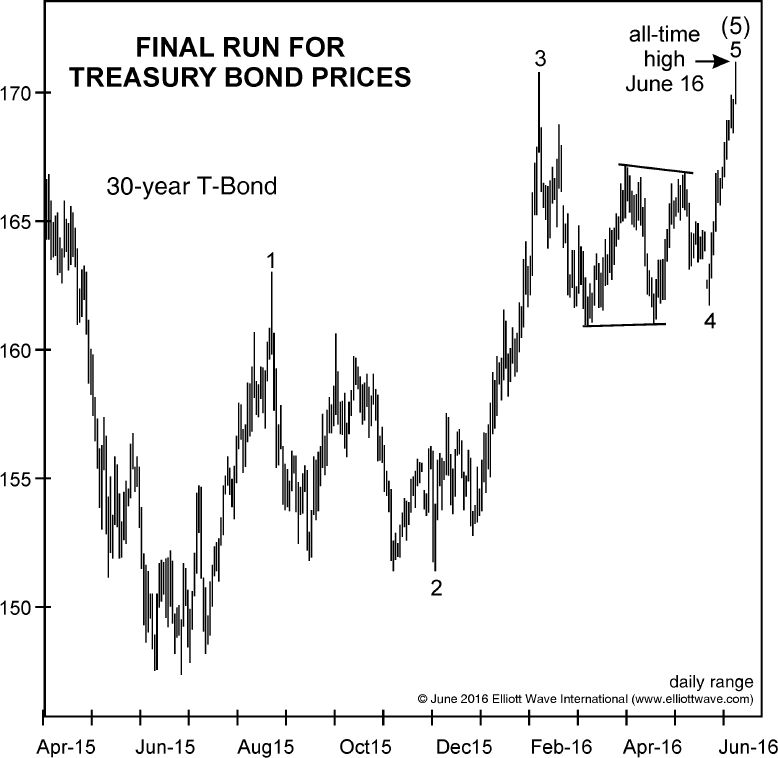
Bond Price Chart Completes Elliott Wave Pattern
|
Recall This Bond Trader Chart? Here’s What Happened Our three recent Treasury Bond charts combine to show you trader sentiment, price action and important near-term turns and trends. Learn the Why, What and How of Elliott Wave AnalysisWatch the Elliott Wave Crash Course, FREE This three-video series demolishes the widely held notion that news… Read more Bond Price Chart Completes Elliott Wave Pattern |
The Decline of the U.S. Retail – Is it Deflation?
|
For those tempted to chalk up the financial troubles of “bricks and mortar” shopping malls to the rise of online shopping, consider this from USA Today (Jan. 27, 2017): While online shopping is growing at a rapid rate of 15% a year, it’s still only 8% of all retail sales. The Decline of the U.S.… Read more The Decline of the U.S. Retail – Is it Deflation? |
The Bond Market Rout
 |
Violent Bond Selloff: An Eye-Opening Perspective In Elliott wave terms, bond investors have transitioned from extreme optimism to extreme pessimism. The bull market in bonds has been running for decades. We may have seen the top. Some call it the greatest bull market of our time, even exceeding stocks. Is it over? Have we seen… Read more The Bond Market Rout |
3 Charts That the FED Does NOT Want You To See
|
We recently saw all-time highs in the stock market,. But does it indicate a healthy economy? Usually the economic indicators lag the financial markets. Markets go up first, recession ends later. Similarly markets go down first and recession appears later. So the market is up. But the US economic data is lagging badly. The economy is going… Read more 3 Charts That the FED Does NOT Want You To See |