Extreme Optimism in Stocks
Prechter is again ringing the bell for the market top at the end of 2023!! Watch the market forcast for 2024, evidenced by many eye opening charts once again from Robert Prechter:
A Stock Market Top For the Ages (Called 2022 top)
Robert Prechter gave a rare, live presentation — “A Stock Market Top for the Ages” — at the annual New Orleans Investment Conference in December 2021.
In just 20 minutes, Prechter shows 28 charts — everything from penny stocks to dollar volume in IPOs to SPACs — to give you a clear, bird’s-eye view of today’s markets.
“Unbelievable” is the word he uses to describe several of these charts.
Eye Opening Charts in 2025
Valuations Are at the Furthest Edge of the Financial Solar System
By Robert Prechter, excerpted from the January 2025 Elliott Wave Theorist.
Figure 1 updates our history of year-end valuations for stocks of S&P companies on two bases: price to book value (Y axis) and dividend yield (X axis). I thought the year-end 2021 overvaluation would never be surpassed. But as you can see, the year-end 2024 reading is both higher and further to the right. It is the highest multiple ever recorded for S&P Industrials’ price to book value and the fifth-lowest level for the S&P Composite’s dividend yield, the four lower readings all occurring in 1998-2001.
We have long called this our Pluto chart. Perhaps we should have expected another extreme valuation near that of 2021. After all, Pluto was discovered to be a planet pair.

The extreme readings of 1998-2001 stayed within the dashed-line channel, but the past six years’ closing valuations are all beyond it. In three of those years — 2021, 2023 and 2024 — price to book value was above that of 1999, the year of the all time high in stock indexes priced in real money (gold)…
Continue reading – free at elliottwave.com..
Eye Opening Charts in 2023
Stock Market Excessive valuation in 2023:
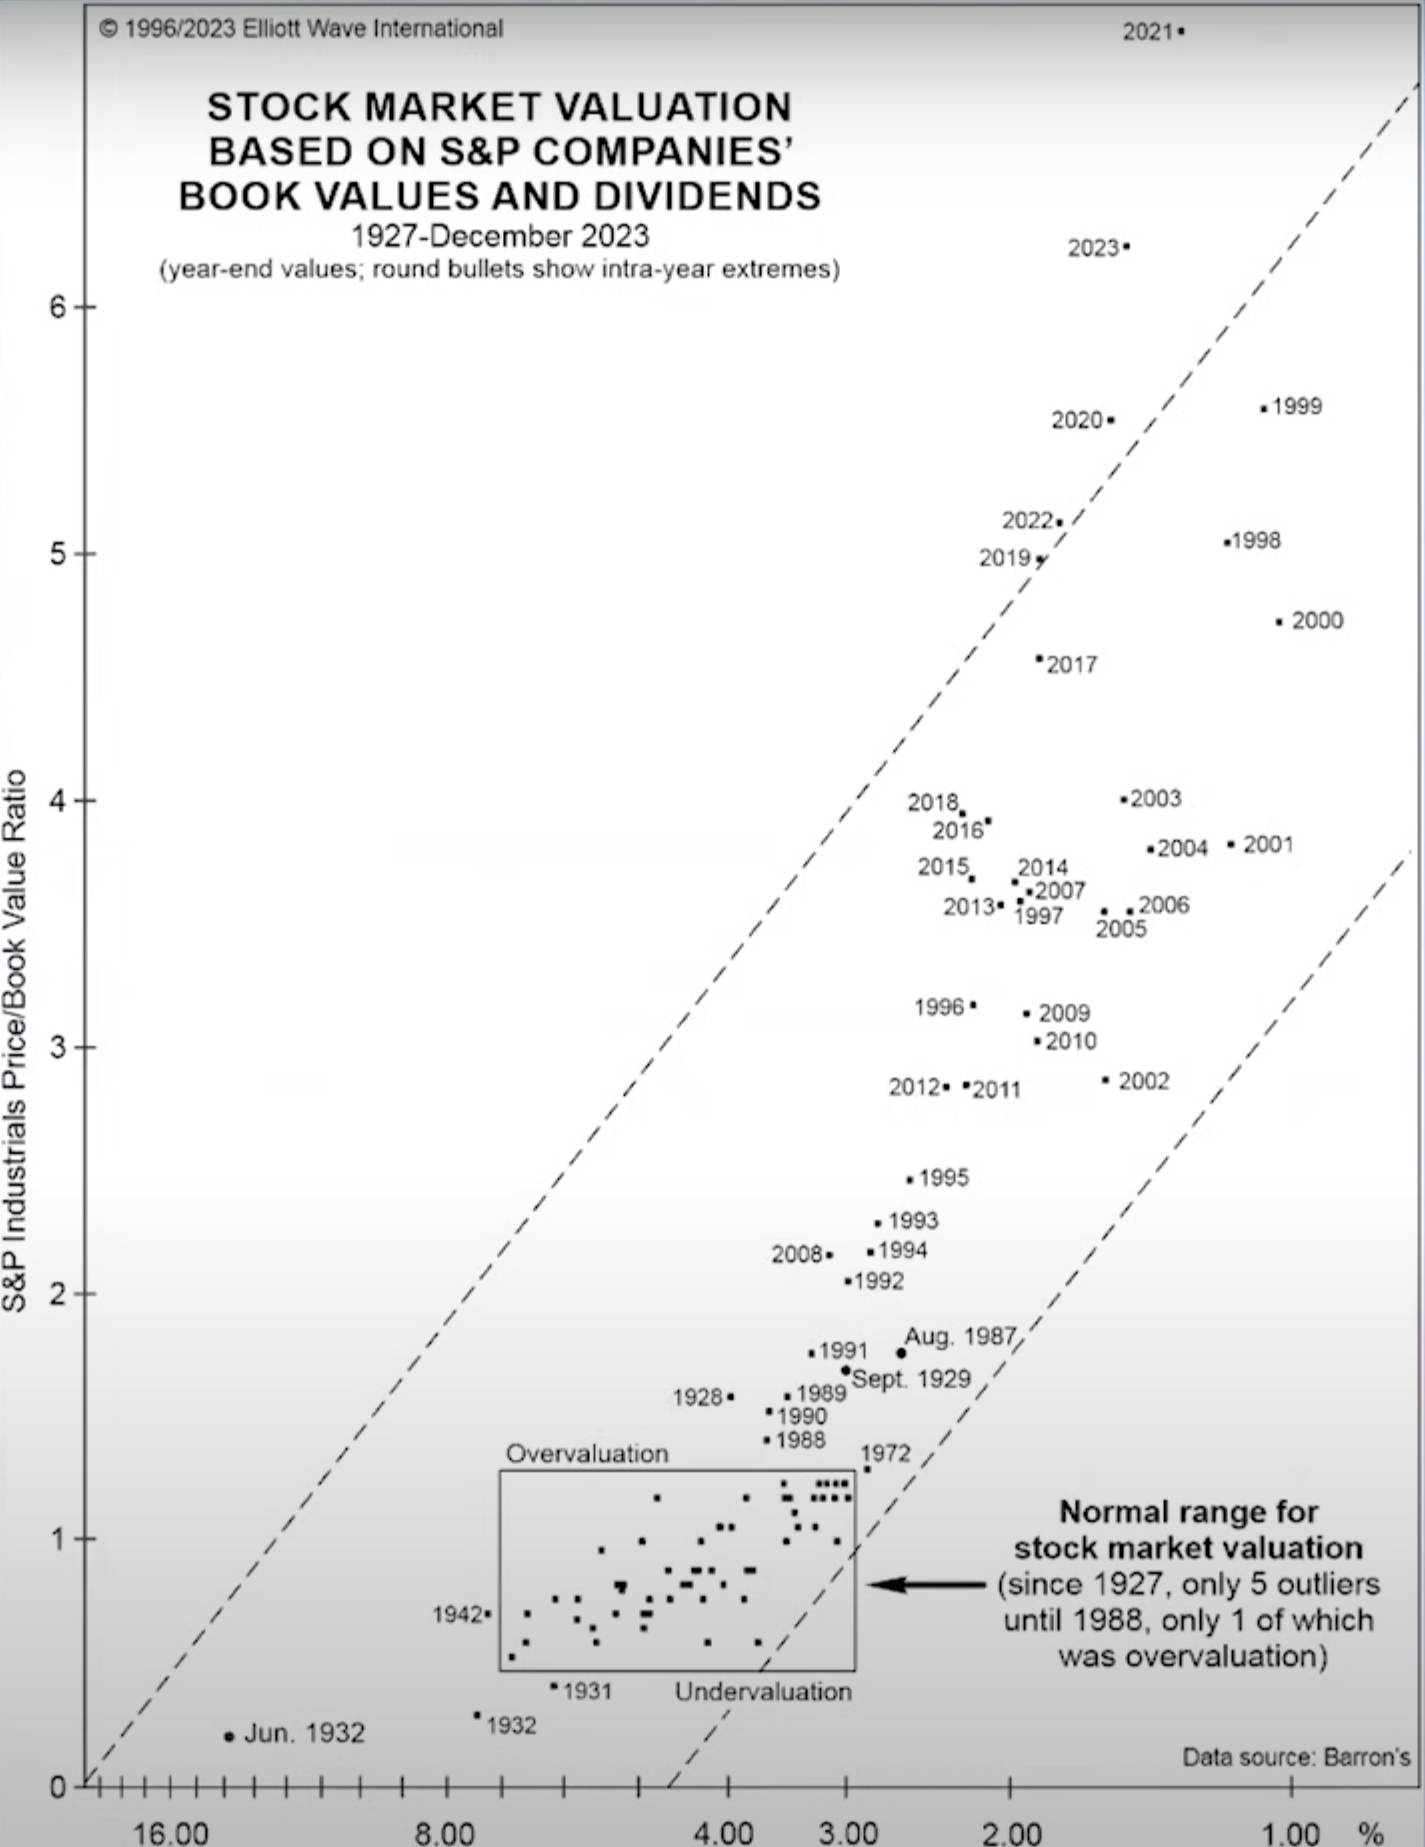
What we have here on the X axis is the bond yield/stock yield ratio for the S&P 400 companies. Sounds fancy, but all it means is that the further you go out to the right, the less companies are paying in dividends compared to what they are paying on their IOUs on their bonds. On the Y axis we have stock prices relative to book value. Book value is roughly equivalent to liquidation value, in other words, if you went and sold all the assets on the open market. When stocks get expensive, prices tend to rise relative to book value, and dividends tend to fall relative to the cost of borrowing. Why does that happen? At such times, people don’t really care about dividends because they think they are going to get rich on capital gains. So dividend payout falls, and stocks get more expensive.
The small square boxes indicate year-end figures. The large box is a general area that has contained values for the stock market for most of the years of the 20th century. We had a few outliers: 1928 and August 1987, which preceded crashes in the stock market. And of course stocks were really cheap in the early ’30s and again in 1941. If you are really astute, you have noticed something about this chart, which is that I’ve left off some of the data. It ends in 1990. What happened in the past two decades? Now I’m going to show you same chart but with the data from the last two decades on it. The March 2000 reading we call Pluto. Real estate wasn’t so bad; I think it only got to about Neptune. But the stock market reached Pluto in March of 2000 in terms of the bond yield/stock yield ratio and the price multiple of the underlying values of companies. And how are we doing now?
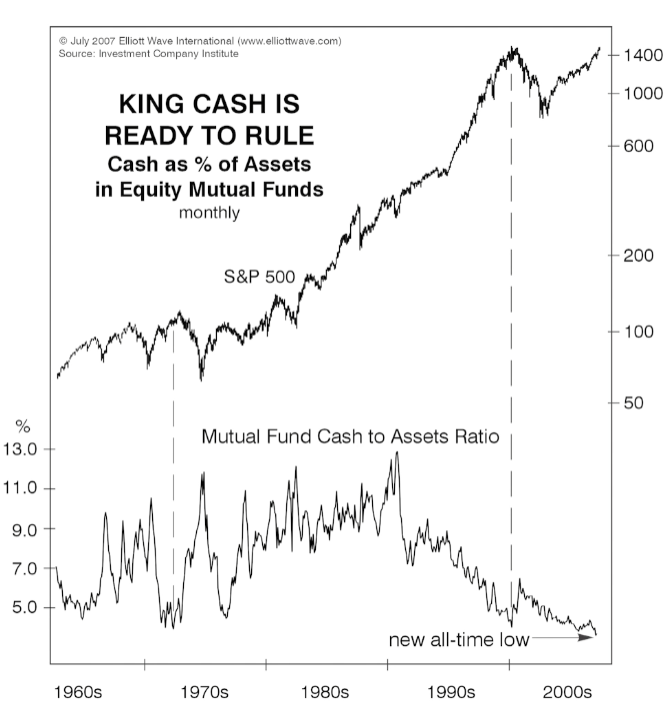
Before the 2008 crash, cash was hated:
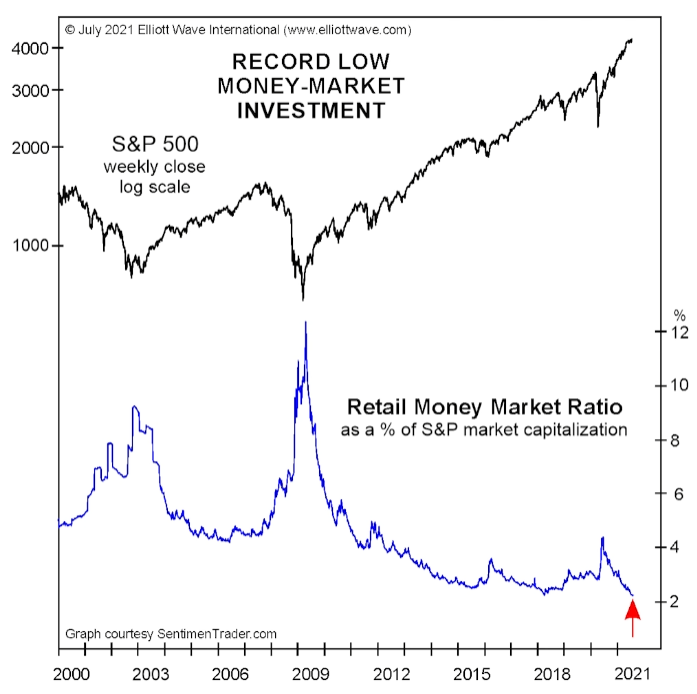
Fast Forward to 2021, we have an all time low record at 2% cash only:
In 2023, we have all time low in cash holdings:
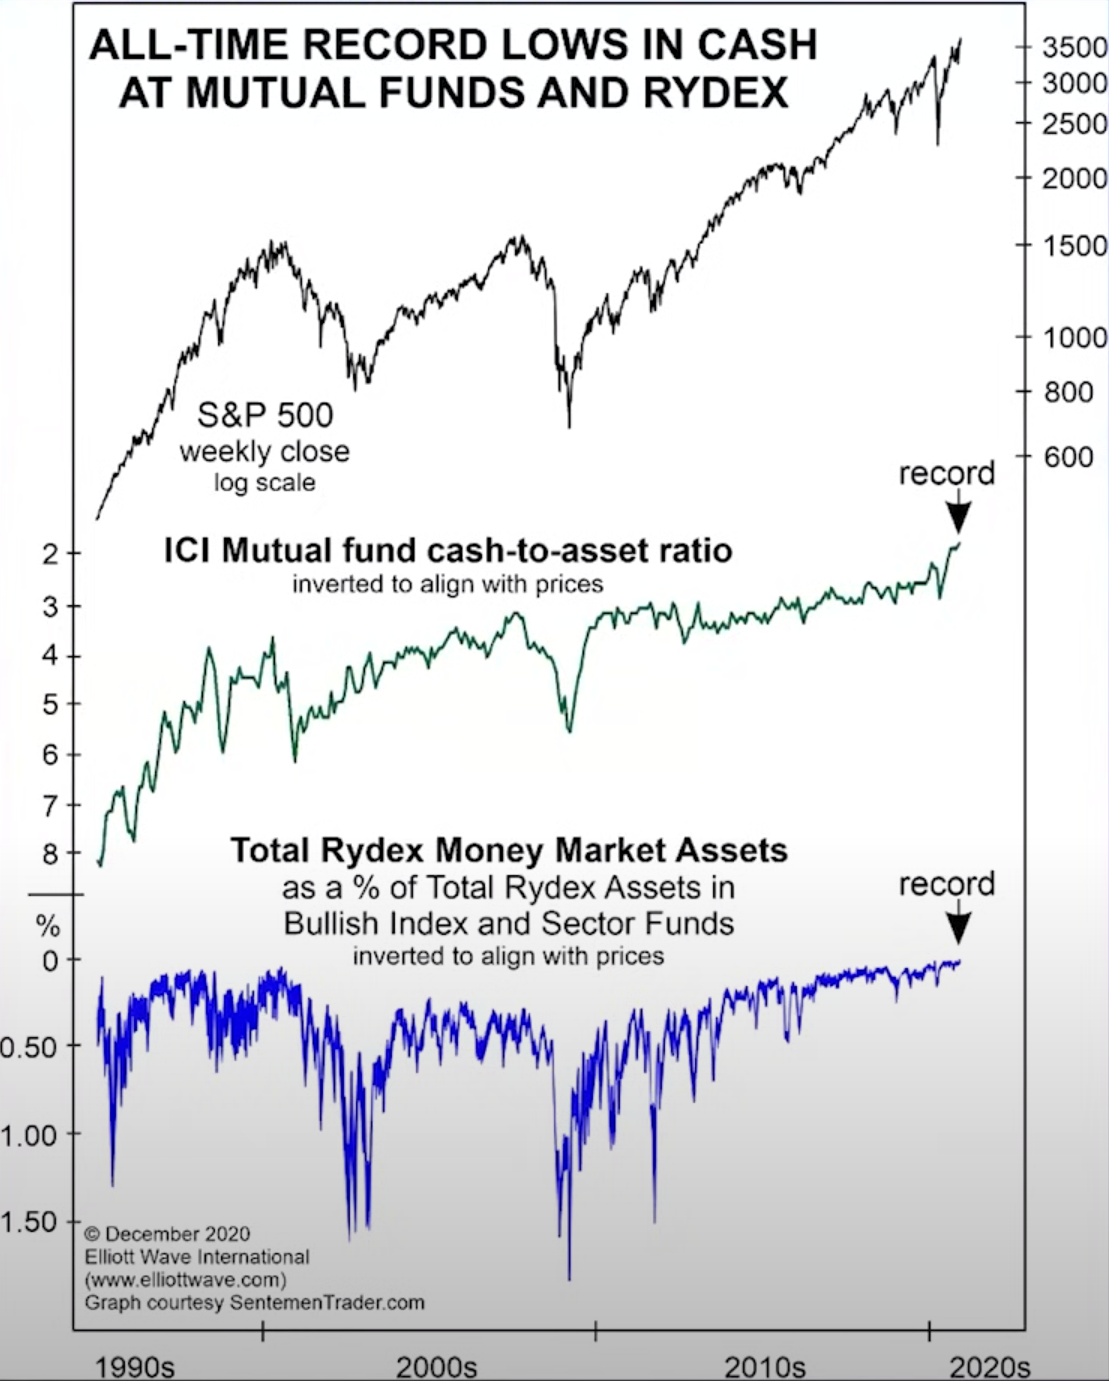
Everybody who can buy has already bought!
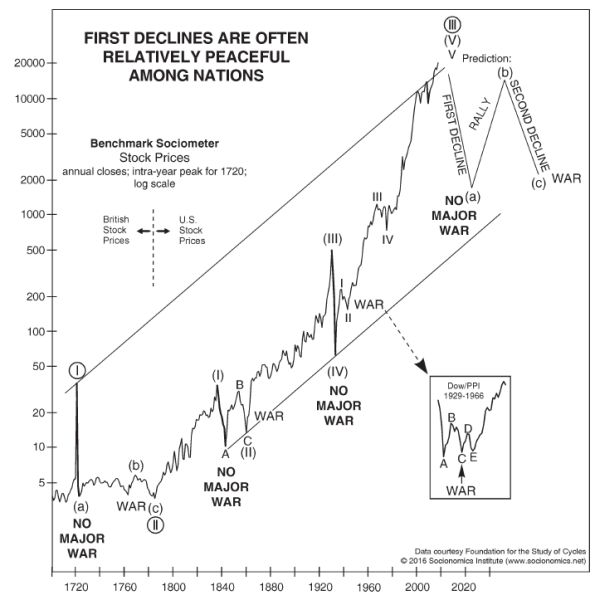
Here is a brief look at the crash that may follow these bubble levels (this is an old chart but conveys the big picture):
Learn more, knowledge is power:
 |
Read 8 FREE chapters of Conquer the Crash; You Can SURVIVE and PROSPER in a Deflationary DepressionThis free, 42-page report can help you prepare for your financial future. You’ll get valuable lessons on what to do with your pension plan, what to do if you run a business, how to handle calling in loans and paying off debt and so much more.Get Instant Access to Your FREE 8-Lesson “Conquer the Crash Collection” Here |
Tragicomic Story of Stocks
Here is the story of irrational exuberance in stocks in a few frames:


