Bitcoin’s 24-Hour Crash: FCA Warning Was a Slap in the Face. But It Wasn’t the Cause.
See what ‘allowed’ for a turn down in the immediate future.
In case you blinked over the last two days, bitcoin bulls had their hat abruptly handed to them when the cryptocurrency plummeted a jarring 26% in 48 hours.
The grisly details (or, here’s how this bearish opportunity unfolded, for the few traders who were ready):
- The selloff was the market’s worst two-day decline since the start of the coronavirus in March 2020.
- The crash took prices $10,000 down from their all-time high near $42,000 set on Friday, January 8.
- And, all told, the move erased nearly $185 billion from bitcoin’s value (Jan. 11 Bloomberg); for reference, that’s the entire net worth of the richest man on Earth, Elon Musk.
After the dust settled, mainstream analysts cited a “cause” for the cryptocurrency’s plunge; a January 11 warning by London’s Financial Conduct Authority (FCA) against all things crypto. Explained the January 11 UK Sunday Express:
“The plunge comes amid warnings from the FCA about the risks of investing in cryptocurrency. The UK-based regulatory body said on Monday investing in crypto assets ‘involves taking very high risks with investors’ money’.”
To clarify: The FCA didn’t suggest those risks were negotiable. It said that consumers who invest in these types of products should QUOTE “be prepared to lose all their money.” (Jan. 11, The Guardian)
That’s a slap in bitcoin’s face if ever there was one. But it’s not the tone of the warning that’s so jarring. It’s the timing.
For one, it comes a week after big bank behemoth J.P. Morgan made one of the boldest, bullish bitcoin forecasts since the 2017 glory days. See:

And secondly, it came three days after the start of bitcoin’s recent turn down; prices had already collapsed 20% from their January 8 high by the time the FCA’s warning went viral.
For bitcoin, this bearish event was a slap in the face on a face that already had two black eyes from being been punched in the nose.
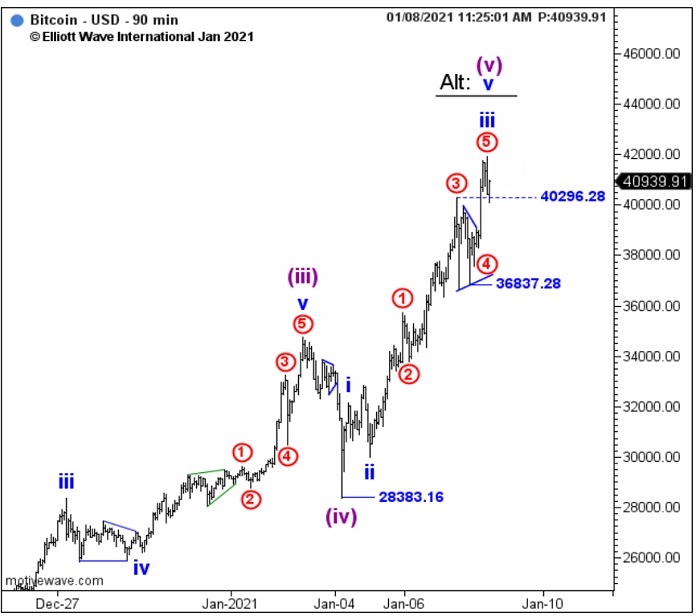
As for seeing the downside potential in bitcoin — before the tide turned — we refer to our January 8 Crypto Pro Service. There, our analysts presented the following price chart of BTC, which showed how the topping Elliott wave pattern allowed for the possibility that a five-wave rally was complete at the current high. In this case, the next move could be a turn lower — that’s how the Elliott wave pattern unfolds. We wrote:
“It will require a close below 35726.82 to suggest five waves are complete from 28383.16 and BTC is heading lower as per the alternate…”

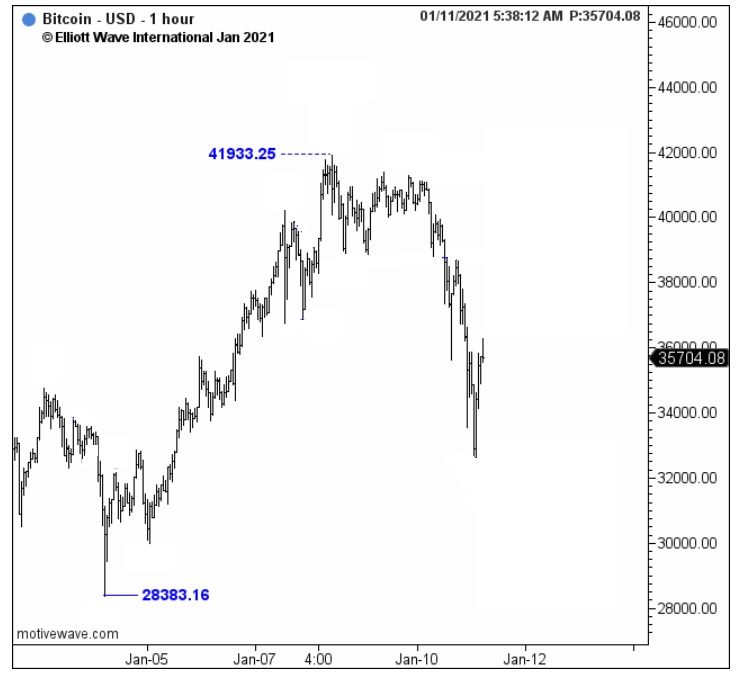
From there, BTC began to weaken. With prices near the 37,000 level, our January 10 Crypto Pro Service intraday update set the stage for a significant decline that could take prices between 1,000 to 4,000 dollars lower. Said Crypto Pro Service:
“We’re counting the peak this weekend at 41933 as the end of wave iii of (v), with BTC now correcting in wave iv. It is counted as a flat pattern and could draw prices towards 32000-36000 before it ends.”
This next chart shows what happened next:

The great divide between bitcoin ultra bulls and ultra bears won’t be closing anytime soon. In fact, it will only get wider as volatility grows. But for traders, loyalty isn’t to one group or another; it’s to the next high-confident set up, be it up or down.
Our free report “Crypto Trading Guide: 5 Simple Strategies to Catch the Next Opportunity” explains more. Each chapter shows you the power of the Elliott Wave Principle to explain some of the recent moves in Bitcoin, Litecoin and Ethereum — and how you can apply this method in your own trading, going forward. “Get instant access now!“