 |
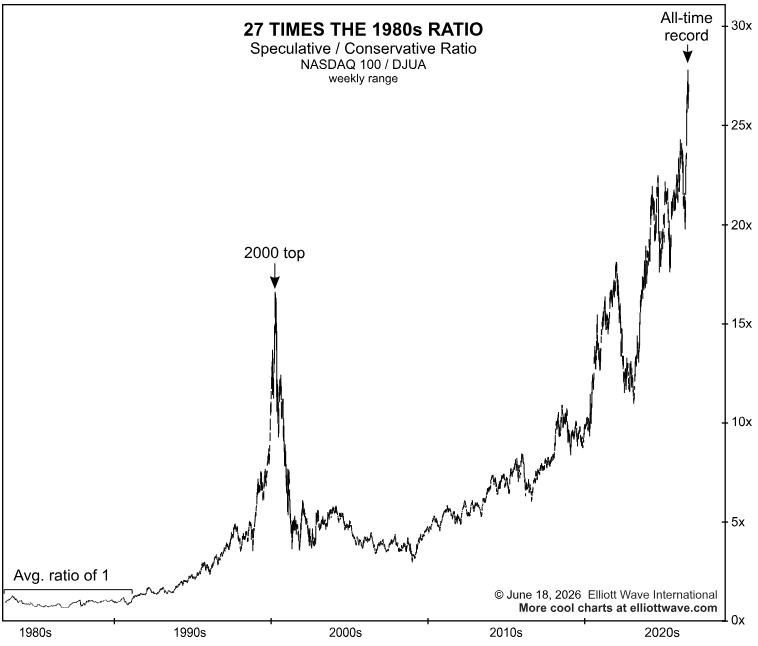
Everyone says, “This time is different.” That’s exactly what investors believed in 2000. One of the most interesting charts I’ve seen compares speculative growth stocks to conservative utility stocks. Today, that ratio sits near 27x — almost double the level reached during the dot-com peak. History doesn’t guarantee the same outcome, but it’s hard to… Read more This time is different? |
Bitcoin at an Inflection Point?
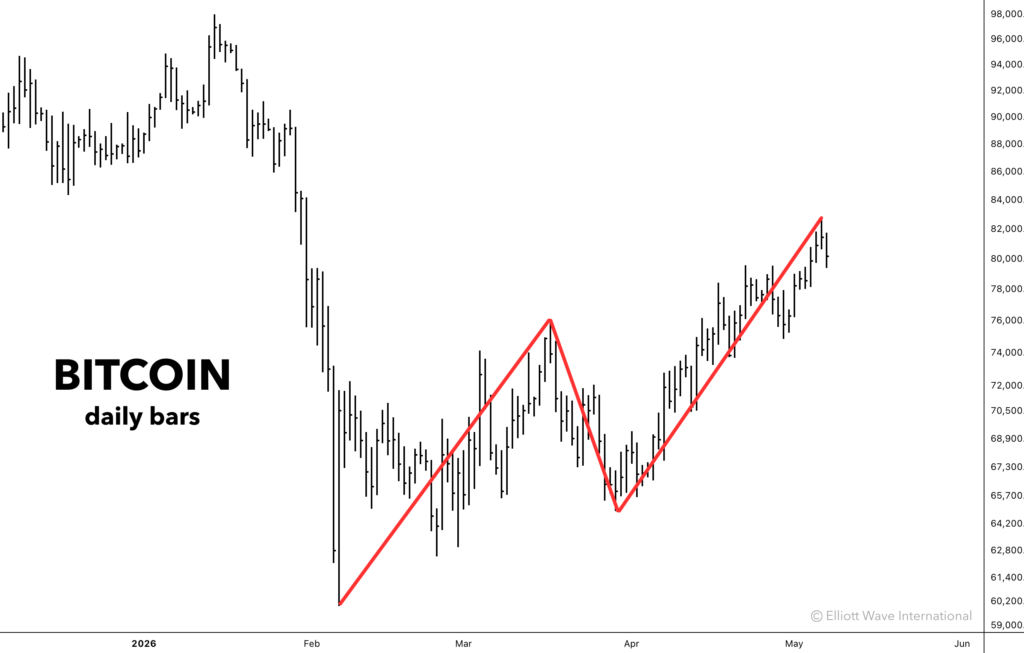 |
When you look at Bitcoin’s price action from the past three months, do you see a pattern you recognize? Elliott Wave International’s crypto analyst Jason Soni does. In fact, he recorded a video for his subscribers where he breaks down the Elliott wave analysis of BTC’s latest moves. The best part: EWI have unlocked the video until May… Read more Bitcoin at an Inflection Point? |
Spotting the Fastest Rally
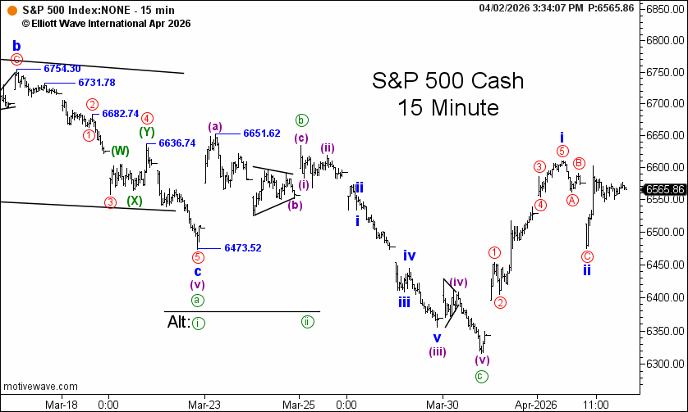 |
What If You Could Spot One of History’s Fastest Rallies Before It Began? On April 2, while bearish sentiment was extreme and many expected lower prices, subscribers to Elliott Wave International’s Intraday Stocks Pro Services were shown a very different setup in the S&P 500. In his 3:35 p.m. intraday update, analyst Robert Kelley posted… Read more Spotting the Fastest Rally |
Trader’s Classroom – Broadcom
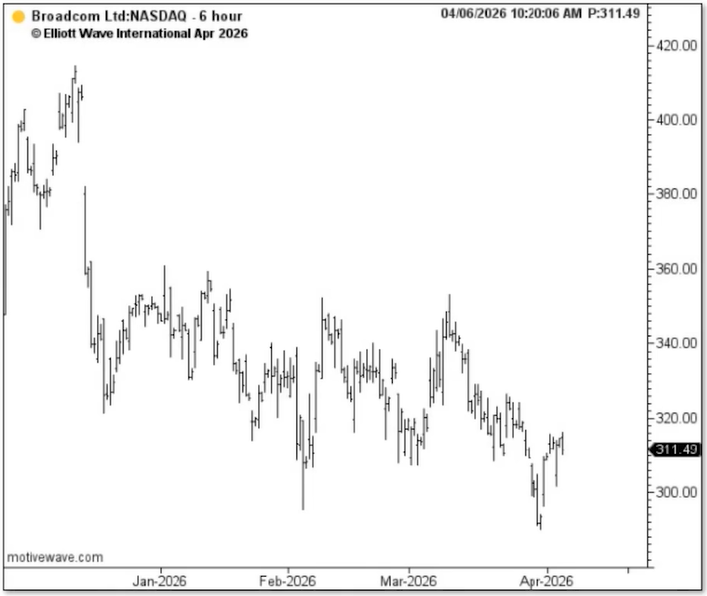 |
Did you catch the 38% rally in Broadcom? On April 6, @elliottwaveintl’s Trader’s Classroom told subscribers, “The price action in $AVGO suggests a fourth-wave correction… probably be one more run to chase the all-time high.” They’re offering 30 days of lessons for just $30. For more insights sign up for the offer of 30 days… Read more Trader’s Classroom – Broadcom |
Trader’s Classroom – Nvidia
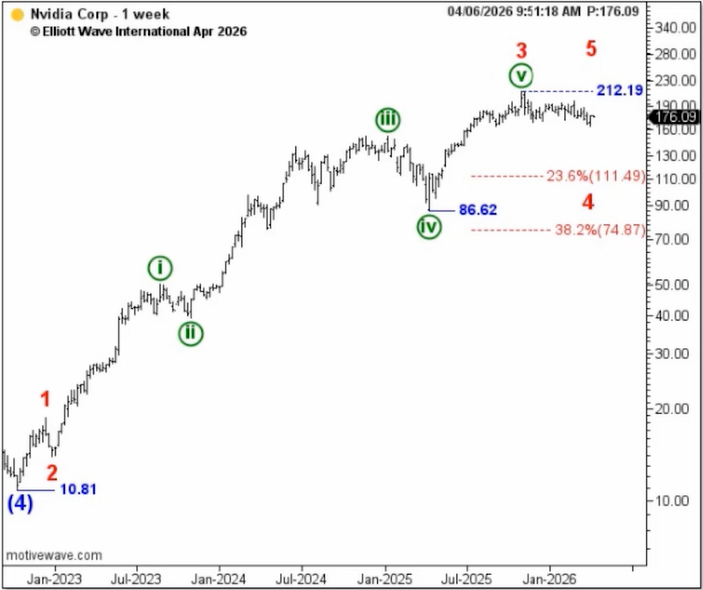 |
Nvidia hits a record high. @elliottwaveintl nailed it with this call in Trader’s Classroom: “the Wave Principle suggests that the bull market in $NVDA is not finished.” Get 30 days of forecasts and lessons like this for just $30. For more insights like this, sign up for 30 days of forecasts and lessons like this… Read more Trader’s Classroom – Nvidia |
Trader’s Classroom – Vaneck Semiconductor
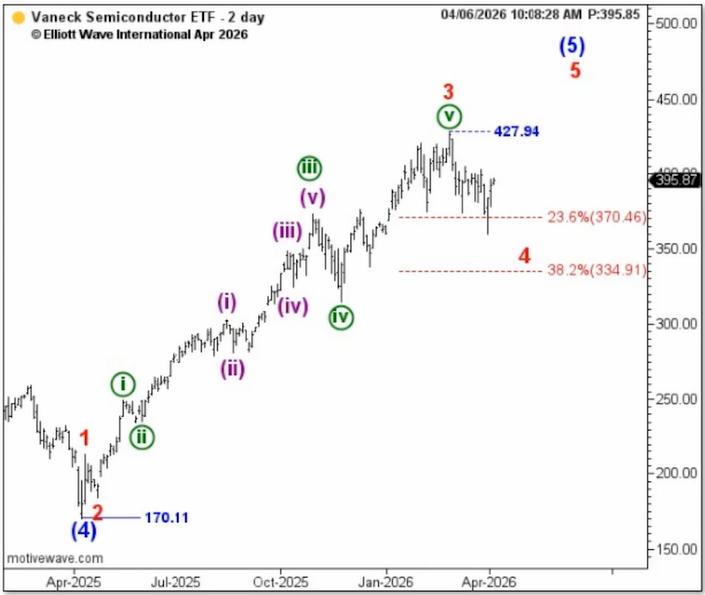 |
What could you have done with a heads up that semiconductors were about to rocket higher? On April 6, @elliottwaveintl’s Trader’s Classroom spotted a fourth-wave pattern in Vaneck Semiconductor ETF — pointing higher. $SMH then rallied $100. Get 30 days of lessons right now for just $30! For more insights like this, get 30 days… Read more Trader’s Classroom – Vaneck Semiconductor |
Margin Debt at Record!
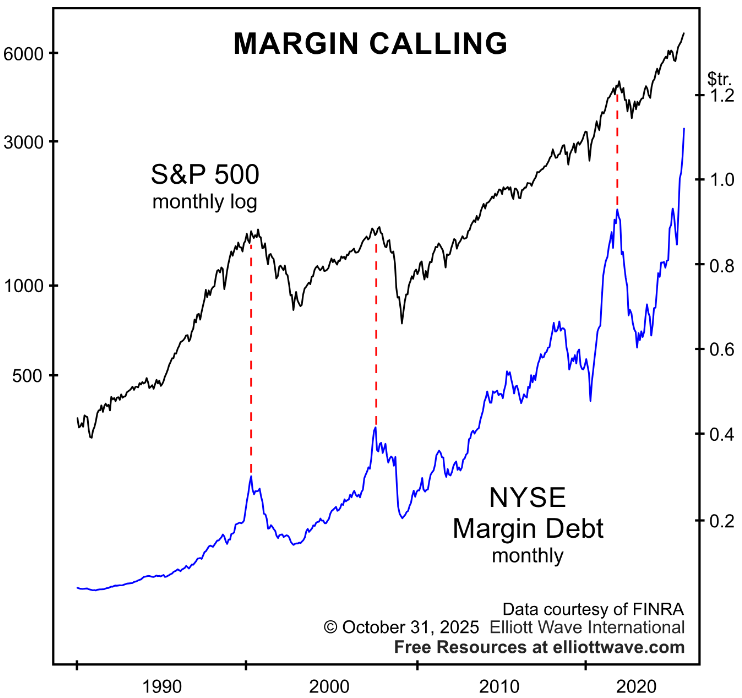 |
Margin debt hits $1.13T — 20% above the 2021 peak! That’s euphoria in numbers. And it’s not the full story: hidden leverage is everywhere. Get free insights from @elliottwaveintl |
At the Peak
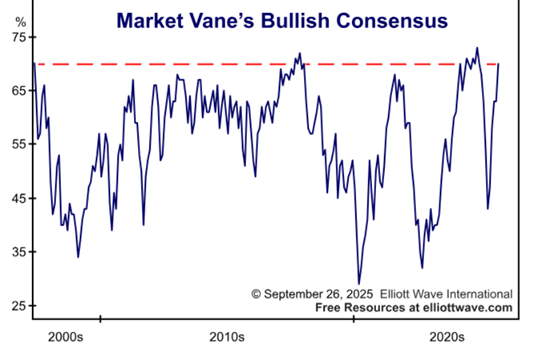 |
Market warning signs are popping up everywhere! Here’s another one that you can share with your audience. The chart below, Market Vane’s Bullish Consensus data, which tracks the buy and sell recommendations by analysts and commodity trading advisors. The current reading of 70 was exceeded only twice since 2010. December 2024 & January 2018 – both ahead of market peaks.… Read more At the Peak |
The Most Dangerous Market in History
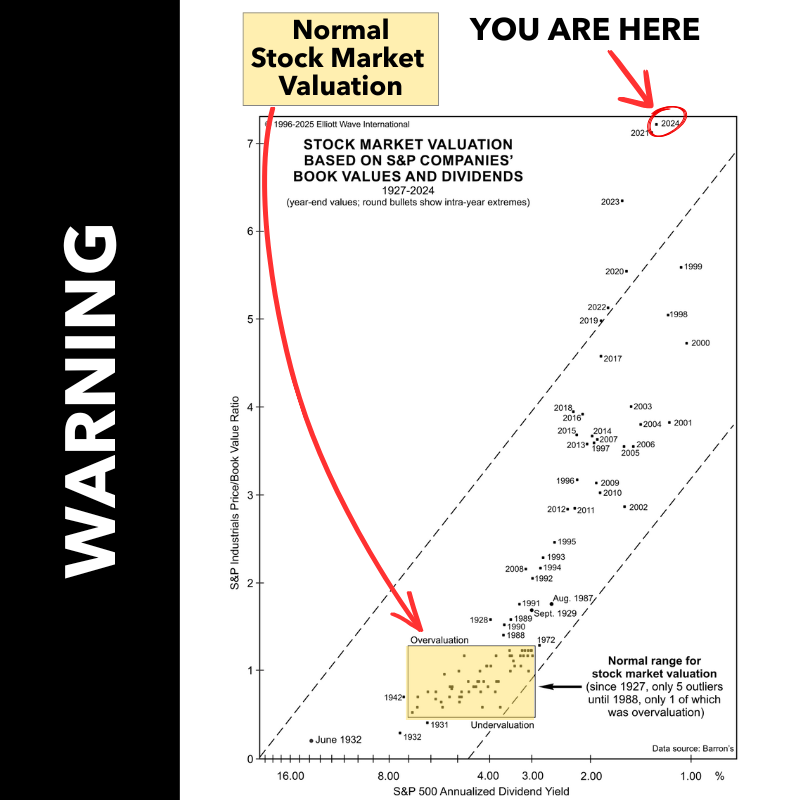 |
A must-read report! 18 charts uncover just how stretched today’s investor optimism has become… and why it’s making today’s market the most dangerous in history. Check it out – free! Download now! Stocks don’t just look expensive… they’re off the charts. A ratio that’s now 4x higher than 2009’s low. In 2009, the Buffett… Read more The Most Dangerous Market in History |
For Whom the Bell Tolls
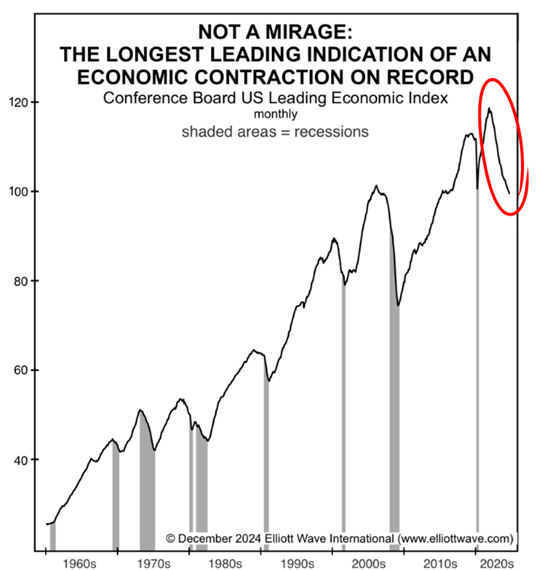 |
Is the U.S. headed for a recession? In the history of the data back to 1959, there has never been a turndown of this magnitude without an ensuing recession. So what can you do NOW to prepare? Our friends at Elliott Wave International have put together a free report called “Preparing for Difficult Times.” It… Read more For Whom the Bell Tolls |